Newsletters
Data for a Better Life
Analytics Advantage is a weekly newsletter of actionable insights, proven strategies, and top tips for getting the most from your data and making high-stakes decisions with confidence. Here’s a recent sample. We hope you’ll subscribe.
***
For many people, the first of the new year is all about self-improvement and starting fresh. But how do you know if you’re actually making progress?
It’s not about feelings or vibes—it’s about data.
As a self-professed data nerd, I borrow a lot of the principles from my consulting work to guide my personal life. Principles like:
- Incremental, steady improvement
- High data quality
- Data is never the whole story
- North Star metrics
When you bring these principles together, the results are dramatically better than just grinding it out or hoping for improvement.
One of the best parts of using data in your personal life is having mostly complete control over the entire process. Depending on how much you do-it-yourself or use apps, it can be incredibly motivating for your professional work.
Picking an Improvement Domain
It really doesn’t matter what domain you want to improve— health, recreation, habits, education, faith– there’s an app for that. Most of these apps are designed to keep you engaged, collecting data on your behaviors. But you can flip the script and use these systems to your advantage.
Some apps make analyzing your data a core feature, while others make it harder to find. Either way, the data is there.
Choose a domain you want to improve. A word of advice: Pick just one. It’s tempting to want to overhaul your entire life every January, but we all know how that works out. Focus on steady, incremental improvements rather than drastic ones.
Once you’ve chosen your focus, decide how to track your progress:
- Collect the data yourself: DIY tracking is as simple or complex as you make it. But simple is always more sustainable than complex. Start with a sheet of paper, whiteboard, or a note on your phone. The key is to make it easy to collect.
- Use an app: Most apps come with predefined tracking systems. While you’re limited to their structure, they usually make data accessible within the app.
Data Quality
If you choose a tracking app, you’ll be working within the schema that the developers created. If you’re DIY-ing it, it’s 100% up to you to maintain data quality.
The golden rule is consistency. No matter whether your data reflects a success or a setback. Don’t flinch from the binge meal, day, weekend. Life happens. No one is perfect. Give yourself grace. But collect the data!
Consistently collecting and using the data for feedback will build the true story of your self-improvement journey.
Data is Never the Whole Story
In previous newsletters, I’ve said this in perhaps a less accessible way: “Data is an abstraction of reality.”
But the truth holds. Data is just one part of the story on your self-improvement journey. There’s always more context than can be captured in the app or your DIY method. Use it to help tell yourself the full story.
How do you accurately track the stress of returning to work in the new year? That first Monday back is the hardest of the year. Or, how do explain why the carefully-built habits you started after the break suddenly faltered?
Sometimes, a lack of data is a compelling part of the story. If you’re tracking books-read, a gap between completing a book can signal a lot of things. A long book, family emergencies, etc. Look for the gaps and the peaks.
North Star Metrics
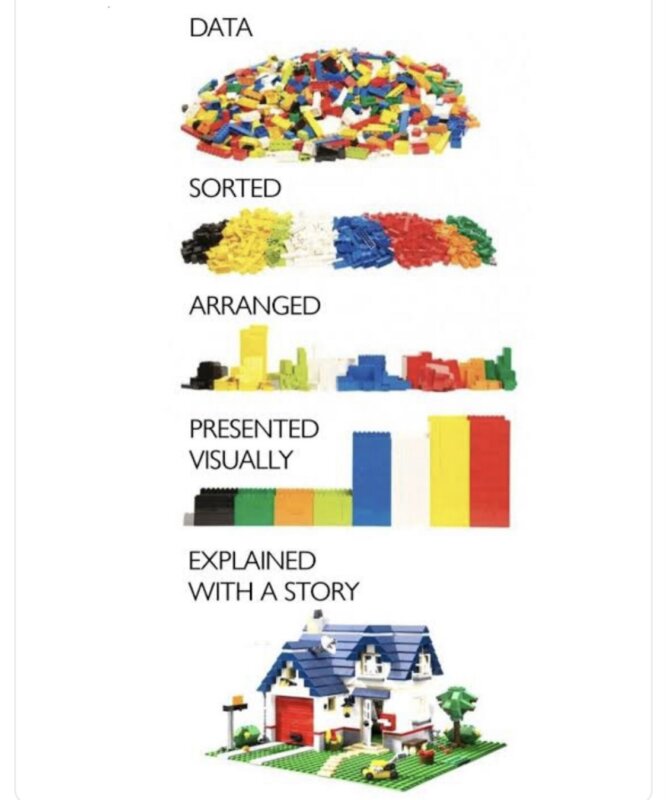
Similar to picking your one improvement domain, pick the “North Star” metric, the single important metric for your improvement journey and focus on it.
North Star metric is a fancy corporate word for the single thing that drives change. Focus on that one metric. Hold yourself accountable (gently) when you don’t meet your goal. Celebrate when you do. But always stay focused on that one thing. It will drive the most change.
Incremental, Steady Improvement
Lastly, focus on slow, steady improvement. If you’re able to simply maintain data collection through January, count that as a massive win. It’s a tough month to get everything back up and running after the break. Set incremental goals. Don’t try to boil the ocean.
Feedback
The value of collecting this data lies in the feedback, the awareness it offers. Your data tells an honest, unflinching story about your process. How it’s interpreted is entirely up to you.
Choose a gracious, positive approach to looking at the data.
Here’s to a new (data-driven) you in 2025. 🙂
Shaun Davis, your personal data therapist, understands your unique challenges and helps you navigate through the data maze. With keen insight, he discerns the signal from the noise, tenaciously finding the right solutions to guide you through the ever-growing data landscape. Shaun has partnered for 10 years with top data teams to turn their data into profitable and efficiency hunting action. Learn more about Shaun.


