

The Business Problem
The Challenge
A global organization needed to understand the return on its advertising investment across numerous countries, marketing channels, vendors, and platforms.
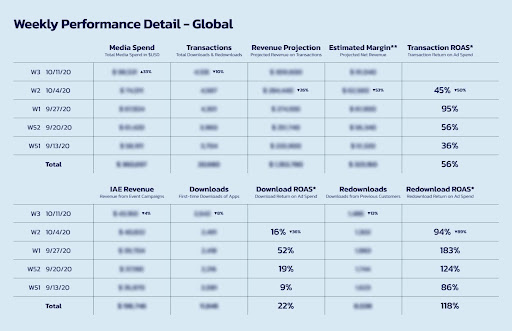
Performance data was distributed across multiple databases. Each week, analysts gathered and cleansed data in spreadsheets, then manually assembled the workbooks and slide decks used for executive briefings.
The scale made the problem particularly difficult. The team monitored spend, revenue, margin, transactions, and return on ad spend across dozens of combinations of countries, platforms, and channels, with leadership needing to understand both current performance and trends over time
Why It Mattered
The manual reporting process consumed about a week of work-hours. This took away from analysts time that could otherwise be spent interpreting the data.
For executives, the problem was different but equally significant. Thousands of individual measures made it difficult to quickly identify emerging trends, compare performance across markets and channels, and determine where advertising investments were performing well or falling short.
Leadership needed both views at once: an immediate picture of overall performance and enough context to investigate what was driving it.
Action's Solution
Our Solution
Action engineered an automated data pipeline that consolidated external marketing data with information from the organization’s enterprise data warehouse.
The consolidated information was organized into a unified analytical model and paired with a redesigned executive reporting experience.
The result brought data integration, analytical modeling, visualization, and executive reporting together in a single system designed to make complex marketing performance easier to understand and act on.
Action's Approach
Action addressed both sides of the problem: automating the underlying data and making that data useful to decision-makers.
Rather than simply presenting thousands of individual measures, Action used Trellis, or small-multiples, visualizations to create a consistent comparative view across countries, marketing channels, and advertising platforms.
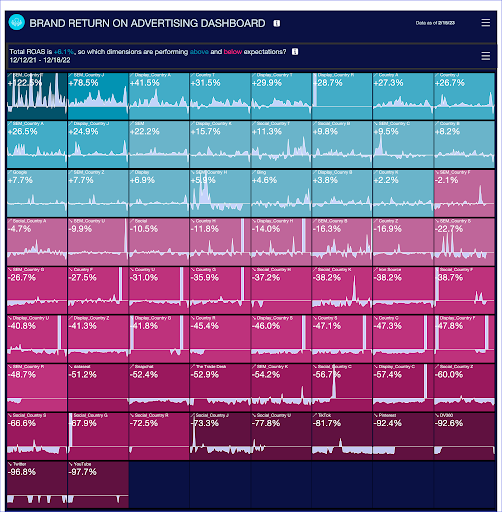
Because the visual structure remained consistent from one view to the next, attention could shift to the data itself: where performance was changing, which segments were outperforming, and which warranted closer investigation.
This combination of data engineering, analytical modeling, visualization, and storytelling transformed a fragmented reporting process into a unified executive analytics experience.
Results and Evidence
The Impact
Executive reports that analysts once built by hand now update automatically, giving decision-makers a continuously refreshed and clearer view of complex marketing performance.
More than 8,000 individual performance measures were organized into a concise, narrative-driven reporting experience spanning a global organization operating across more than 100 countries.
The new environment made it easier to compare performance, identify high- and low-performing segments, and move from a high-level executive view into the underlying detail.
The Result
More than 8,000 marketing performance measures were transformed into a unified, narrative-driven executive reporting experience designed to make complex global advertising performance easier to understand and investigate.
By the Numbers
8000+
Marketing performance measures consolidated into a unified analytical and reporting experience.
100
Countries represented across the organization’s global marketing environment.
5
Core measures tracked across the program: spend, revenue, margin, transactions, and return on ad spend.
66
Approximate combinations of country, platform, and channel monitored across those five measures.