

The Business Problem
The Challenge
A Fortune 5 technology company needed to modernize an internal analytics application that had begun as an AI-assisted prototype. Originally developed by a data scientist, the application demonstrated a promising concept, but it lacked the reliability, usability, and design consistency needed for broader business use.
The prototype had emerged partly because the existing Tableau environment struggled with growing data volumes. Addressing the underlying data bottlenecks would have required changes to shared infrastructure managed by another team. A custom web application offered a way forward without disrupting those dependencies.
But the prototype introduced problems of its own. Dashboard panels sometimes timed out or displayed no data. Navigation was becoming difficult to manage, screens lacked consistent design patterns, and users struggled to move from summary metrics to the underlying explanations.
These limitations became especially apparent when the application failed during a demonstration to business partners. What had initially impressed executives as a promising concept was not yet dependable enough for the situations in which it mattered most.
Why It Mattered
The application needed to support confident, informed conversations about business performance. Unreliable reporting and inconsistent navigation made that difficult, undermining trust in the product and creating additional support demands.
The small internal product team also faced a broader challenge. Without shared design patterns and reusable components, each new analytics application risked repeating the same design and development work.
The client needed to solve the immediate product problems while establishing a foundation that could support future applications more consistently and efficiently.
Action's Solution
Our Solution
Action approached the engagement as both a product redesign and an opportunity to create a reusable design infrastructure.
The team first addressed the application’s reliability problems, identifying and correcting the causes of intermittent timeouts rather than simply increasing system limits. The resulting panels loaded consistently, with measured response times of approximately 6 to 15 seconds for a mid-sized customer, within the application’s 25-second limit.
Action then redesigned the interface around how users needed to explore and understand their data.
An overflowing tab bar was replaced with a collapsible sidebar. Instead of opening to an empty screen, the application now presented a populated account overview, including data-freshness information and a weekly highlight.
Reports were reorganized to explain what changed and why, with supporting charts and detail cards visually connected to the relevant findings. A guided walkthrough and in-product glossary helped users navigate the application and find answers to common questions.
The redesign also established a clear structural distinction between human-verified analytics and AI-generated responses, helping users understand the source and nature of the information they were viewing.
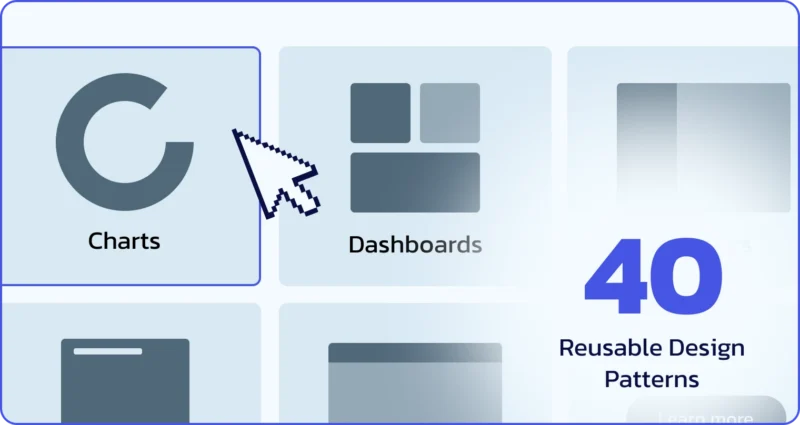
Beyond the application itself, Action extracted approximately 40 reusable design patterns across eight categories, including navigation, layout, typography, buttons, cards, tables, and data visualization.
Each pattern included a live preview and production-ready code. The library was built on the client’s internal design standards, checked against the live application codebase, and designed to support export for AI coding assistants.
Action's Approach
Solve the immediate problem. Build for what comes next.
Rather than treating the engagement as a one-time visual refresh, Action approached the redesigned application as the starting point for a broader family of analytics products.
Every major interface change addressed a specific user problem, from unreliable panels and confusing navigation to difficulty understanding the relationship between summary metrics and supporting data.
The reusable component library was developed from the functioning application, not from an abstract design exercise. This meant the patterns reflected actual implementation decisions and could be checked against production code as the product evolved.
Action also made trust an explicit part of the user experience. By separating human-verified analytics from AI-generated answers through the interface itself, the team established a design principle that could carry forward into future AI-enabled analytics applications.
For the client’s small product team, this approach created a practical foundation for continued development. Future projects could draw from established patterns, live examples, and working code rather than recreating fundamental interface elements.
Results and Evidence
The Impact
The engagement transformed an unreliable prototype into a more dependable, coherent analytics experience.
Performance testing confirmed consistent panel loads of approximately 6 to 15 seconds for a mid-sized customer, within the application’s 25-second limit. Users gained a populated landing experience, clearer navigation, and report layouts that made it easier to connect headline metrics with their underlying explanations.
The redesigned application was demonstrated to business partners before the project was complete, receiving a strongly positive response. This represented a significant turnaround from the earlier demonstration failure.
Action also delivered a verified library of approximately 40 reusable patterns across eight categories, creating a common design and development foundation for future analytics applications.
At the time of the source record, rollout to three teams was underway. Broader adoption, reductions in development time, and long-term usability improvements remained to be measured.
The Result
Action turned a fragile analytics prototype into a more reliable, usable product while establishing a reusable design system for future development. The client gained an improved application experience and a production-grounded component library intended to help additional teams build consistently without starting from scratch.
By the Numbers
~40 Design Patterns
Reusable, documented patterns extracted from the application and checked against the live codebase.
8 Categories
A shared design foundation covering navigation, layout, typography, buttons, cards, tables, and data visualization.
6–15 Seconds
Measured panel load times for a mid-sized customer, within the application’s 25-second limit.
3 Teams
Planned recipients of the redesigned experience and reusable components, with rollout underway at the time of reporting.