Thought Leadership
A Tableau-Native Rounded Corners Hack
There seems to be a lot of interest in rounded corner layout designs in Tableau. Some approaches require third-party tools, such as Figma.
Rody Zakovich recently created one with a Tableau extension. Irene Diomi proposed [a native approach] with annotation-based framing. Most of these are good for fixed-size dashboards.
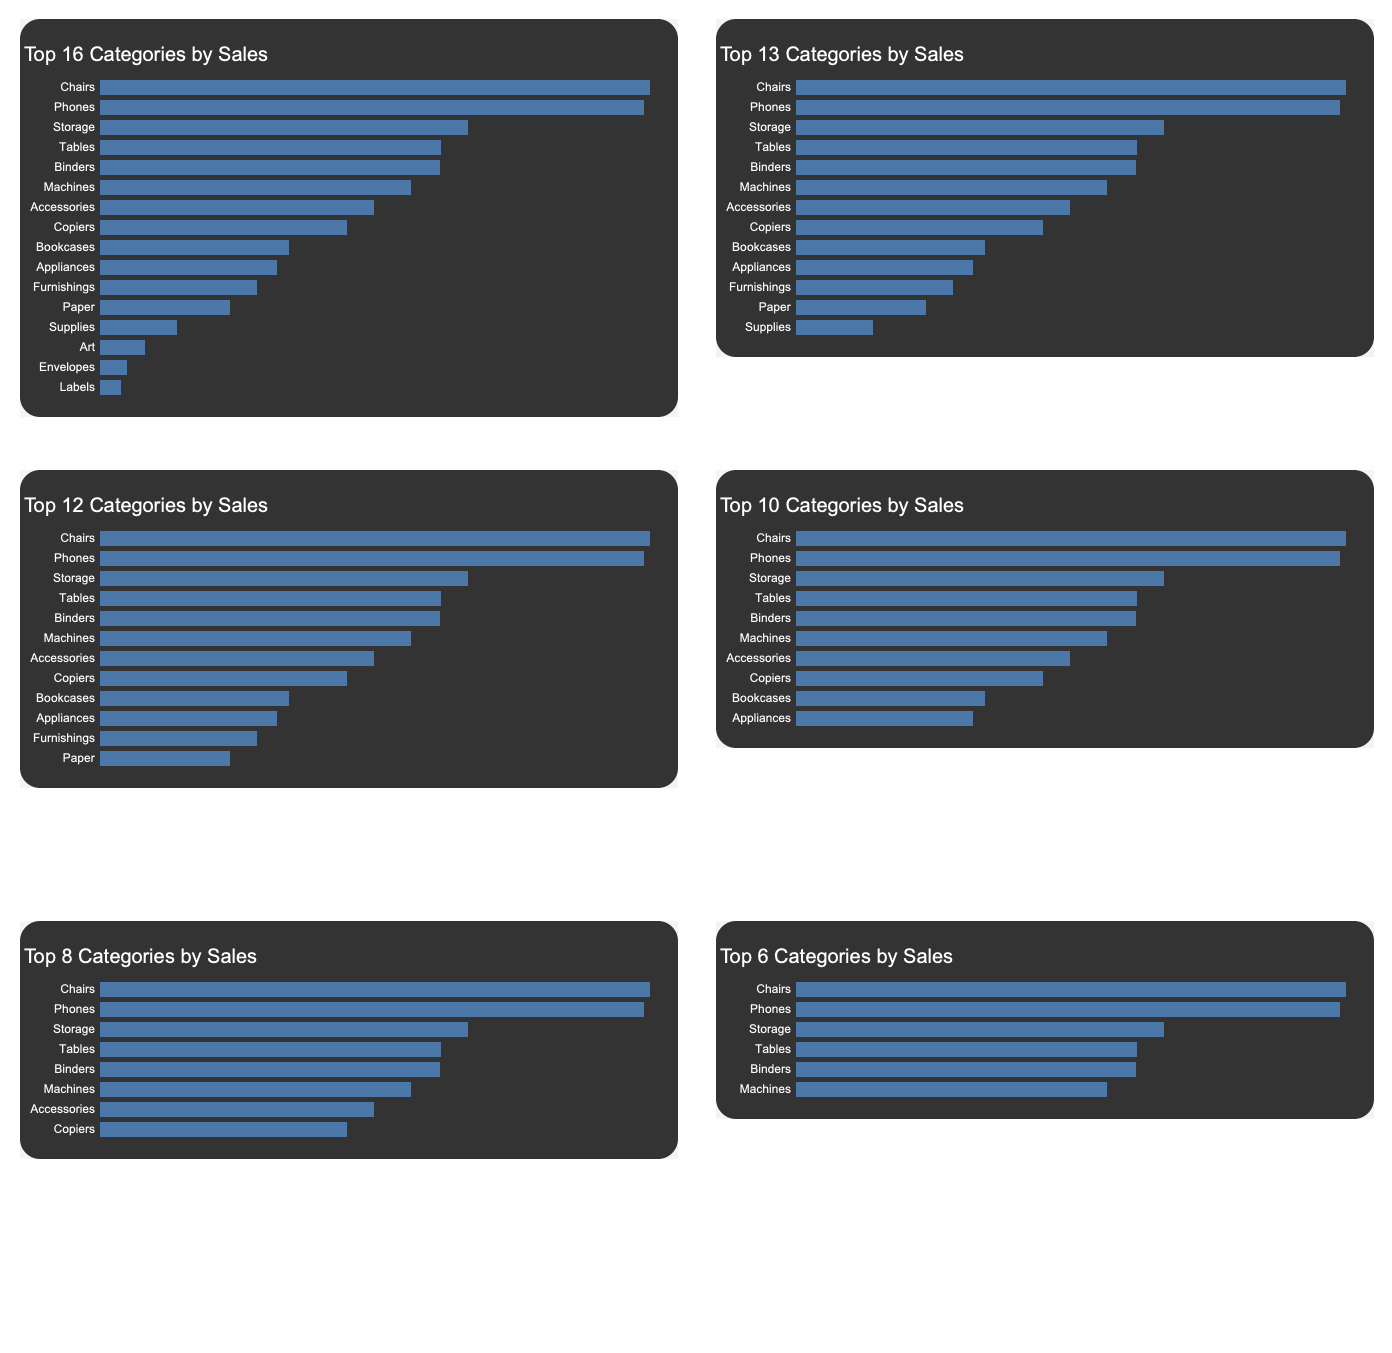
Several weekends ago, I created this rounded corner hack. It is 100% Tableau-native. It’s container-based, and very elastic. In searching for prior art, I found that Robert Curtis had a similar idea of a container-based approach in 2019. He used some other tools to create round- and other-shaped corners.
A great thing about being container-based is not only that it’s elastic, but also that we can replicate it with simple copy and paste, a Tableau feature published in version 2021.4.

We also provide a simple mechanism for generating the corner images in Tableau. The colors of the corners can be customized, according to your needs, using the native color picker.
You can download the tool here. Feel free to play with it. And let me know if you have any questions.
Below are some detailed instructions on the use of the round corner maker.
Round Corner Image Maker
Generate a round corner image for each of the 4 corners:
1. Click either the corner color and background color to customize them
2. Select each corner to generate each of the 4 corner images
3. Pick a less or more rounded curve
4. Export image for each of the 4 corners
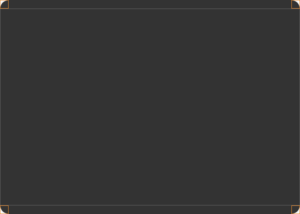
Container Template with Custom Round Corners
Create a new template with different colors:
1. Use the image maker to customize the colors
2. Use the image maker to create 4 corner images
3. Note that the 4 corners of this template are 20×20 image objects. Replace them with the new images.
4. There are 3 blank objects in the template: Top/Middle/Bottom. Change their background color to the new one using the layout manager
5. Set the padding to be 0 by default
Compose a new dashboard layout by copying/pasting this round corner template container:
1. Select the entire template container (the outermost one)
2. Press Control-C to copy it
3. Press Control-V to paste it into a dashboard canvas of interest
4. Shift-Drag the template to place it into a tiled container
5. Replace the middle blank object by your sheet(s)
6. Format your sheet background shading to be the same as the template
7. Set any outer container background to be of uniform color
Dashboard Template with RC Container Modules
Here we provide rows of RC modules that you can copy and paste into your canvas. Say, if you need 5 key performance indicator (KPI) modules in a row, just copy the container that has 5 RC modules into you dashboard canvas first. Then customize each KPI module with your own charts.
Dashboard Examples with RC Container Modules
We included three dashboard examples with round corners of different colors. To optimize the process, first we need to plan the colors. Second, build a container with round corners. Third, replicate the container to create a dashboard layout. Fourth, replace each container with your custom charts.


