Action Bits
Action Bits: URL Images in Tableau
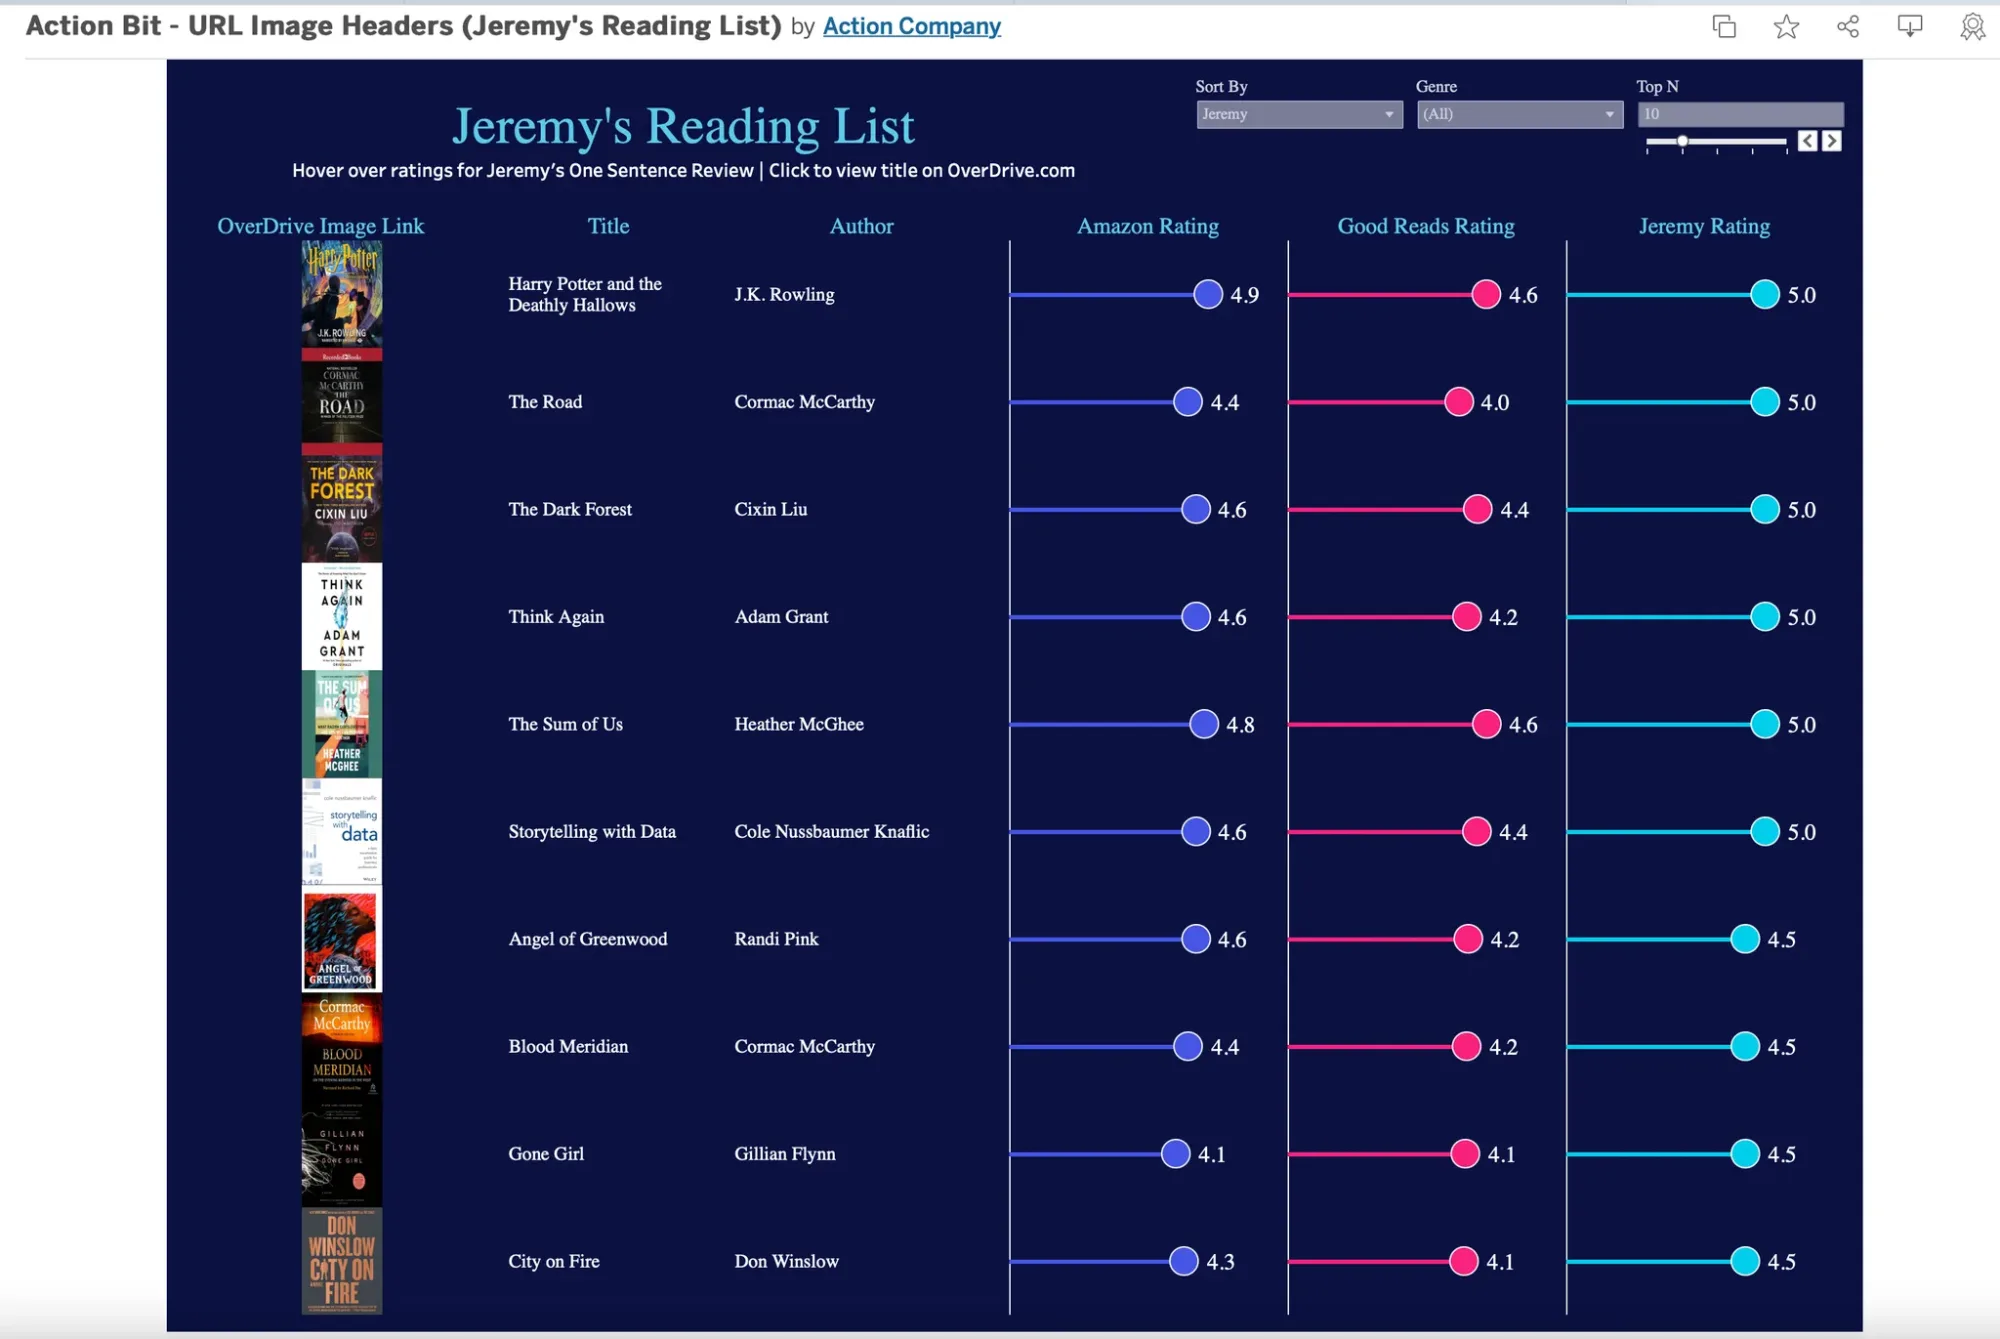
In this how-to, I will show you how to enhance your Tableau dashboards by integrating web images via URLs. This step-by-step guide is a companion to the Action Bits video. In it, I show you how to prepare your data, import images into Tableau, and leverage tooltips for interactive dashboards. For this tutorial, I created a dashboard for the OverDrive books that I’ve read on the Libby app.
Step 1: Preparation
Before diving into Tableau, gather up your assets:
–Image URLs: Right-click on the desired image online and choose Copy Image Address.

– Spreadsheet Setup: Prepare an Excel sheet with relevant fields. In this case Title, Author, Image Link, Genre, and Ratings from Goodreads, Amazon, and personal reviews.

Example fields might look like this:
– Title: Angel of Greenwood
– Author: Randi Pink
– Image Link: URL of the book cover
– Ratings (1-5 scale):
– Goodreads
– Amazon
– Personal
Step 2: Adding Image URLs in Tableau
With your spreadsheet ready, import it into Tableau:
1. Drag your Excel spreadsheet into Tableau.
2. Locate the image link column. Initially, it appears as a string field.
3. Change the field type to Image Role: URL.
4. Drag the field onto your rows, and voilà! Your images now appear within Tableau.
This process enables dynamic visualizations by adding imagery to your data.

Step 3: Adding Visual Flair with Tooltips
For an extra layer of interaction, incorporate tooltips with images, titles, and authors.
1. Create a worksheet using the OverDrive image field.
2. Create a tooltip using worksheet in the previous step, including key information like the author, title, and rating.
3. When users hover over the book titles or ratings in the dashboard, the tooltip displays additional insights.
This is especially useful if your dashboard contains many titles. Users can hover over an item to see a larger preview without cluttering the view.

Sharing Your Tableau Workbook on Tableau Public
Once you’ve polished your dashboard, share it with the world!
– Publish the workbook to Tableau Public. Mine is under Jeremy’s Reading List.

– In the published version, users can explore books you’ve read and view ratings from different platforms.
Key Takeaways
– Simplified Image Import: Copying and pasting image URLs is easy and efficient.
– Interactive Visualizations: Tooltips enhance the user experience by displaying additional information on hover.
– Unified Ratings View: Combining multiple rating sources creates a more comprehensive dataset.
Try it Yourself!
Follow these steps to create your own interactive Tableau dashboard with web images and tooltips.
For more inspiration, check out Jeremy’s Reading List on Tableau Public.


