Newsletters
How Business Organization Can Boost Your Data Efficiency
Analytics Advantage is a weekly newsletter of actionable insights, proven strategies, and top tips for getting the most from your data and making high-stakes decisions with confidence. Here’s a recent sample. We hope you’ll subscribe.
***
The Power of Organization
There’s a huge benefit to organization, which I’ve witnessed directly over the course of my career in data.
Often, I’m brought into companies that have very messy data. Spreadsheets are scattered, data is unstructured, communication is inconsistent, and terminology varies. This chaos makes it difficult to get anything done efficiently.
Life can be chaotic in general, and we’ve all seen the meme about living through unprecedented times.

That disorder often spills over into our work life, making things harder to manage.
One way to bring order to the chaos is by creating structure, and that starts with something as simple as a “user story” (see below). Creating such a user story is a quick exercise—5 to 10 minutes—but the long-term benefits can be huge.
Not only will it improve your focus and make your dashboards more effective, but it can also help your company and your life.
How Organization Helps the Brain
On a mental health level, organization helps our brains to relax and focus.
When dashboards are cluttered with lots of “non-data ink,” our brains get distracted by the noise. But when things are organized, we zero in on the important details and can process information more easily.
A well-structured dashboard doesn’t just look clean; it allows us to focus on insights without getting lost in unnecessary noise.
I’ve seen companies whose data is chaotic. They’ve built systems internally, but they weren’t structured well. This often caused confusion, making it harder for teams to know what to focus on. Introducing user stories, intentional information design, and clear communication, creates a ripple effect throughout the entire organization.
The order doesn’t just stay within the data, it spreads outward through the entire company, turning messy data into something much more structured and intentional.
Time is Money: The Hidden Cost of Chaos
The hidden cost of disorganization is time—and in business, time is money.
I’ve worked on volunteer or family projects where we had tons of tools, but nothing was organized.
Think about the last time you had to start a task, say painting a room. You’re excited about starting the project, getting it done, only to discover that the tools are not where they should be and the brushes weren’t cleaned after the last use. Suddenly, what could’ve been a quick and satisfying job turns into a frustrating chore before you’ve even begun.
The same thing happens in business, and this disorganization costs you valuable time and resources.
Creating a User Story
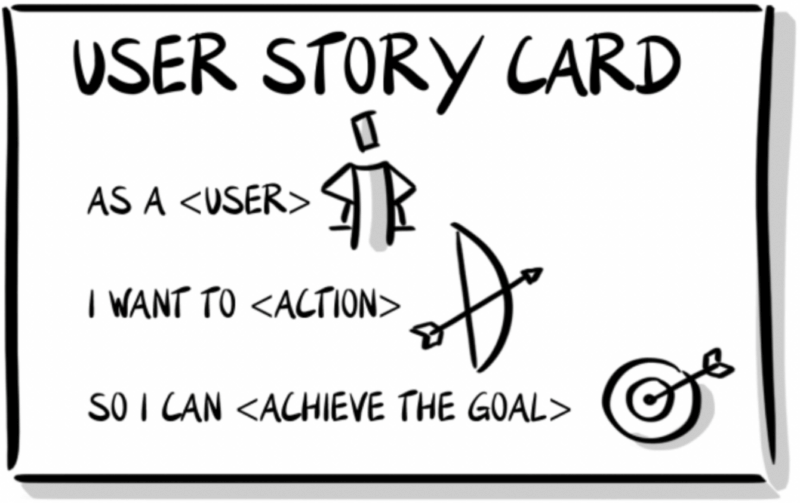
A user story comes from the Agile methodology of doing work, and it’s a simple sentence that defines a task. It follows this general format:
As a [persona], I want to [goal], so that I can [specific outcome].
For example: “As a business owner, I want a dashboard of sales by year, so that I can understand how our sales are trending over time.”
This sentence helps define who the work is for, what they’re trying to achieve, and what the outcome should be. It’s a concise and effective way to organize tasks.
Additional Elements to Support a User Story
In the user story, you can include additional elements to further structure and define your work.
Adding acceptance criteria describes what “done” looks like, giving clear expectations for what the final product should look like. Think about bonus features that go beyond the core task but would be useful to have. Consider influences, such as external factors or processes that might impact the task, as well as dangers, which are risks if the data or outcome is incorrect.
Finally, define the product value. If you can’t clearly state its value, it’s important to reconsider the task’s purpose.
Intentional Information Design
Intentional information design is about being purposeful in how you present information. A lot of data chaos comes from inconsistent or unclear terminology.
For example, a data engineer might give you a table of codes without translating them, leaving you to wonder what “ABF” or “JQZ” mean. Or, people might use “sales” or “profit” interchangeably, which can cause confusion.
Intentional information design means thinking clearly about how you present your data and making sure everyone is on the same page. Every time you mention “sales,” it should have a consistent definition. If you have different types of “sales,” internal versus external, for example, each should be clearly defined.
This consistency helps avoid confusion and saves time.
Clear Communication
We’ve talked about this before: the brain processes visual information much faster than text. So when you can, use visuals or videos to explain concepts. A five-minute video can sometimes be more effective than a lengthy document.
We’re all dealing with information overload from platforms like Slack, Teams, emails, and meetings. Being intentional about communication—using consistent terminology and formats—helps keep things organized and reduces stress for you and your colleagues.
Clear communication also ties back to human compassion. Think about how you’d like to receive information. I always try to document things in a way that, if I revisit it six months later, I can easily understand what I did.
It’s not about perfection, it’s about intention.
Closing
Organization isn’t just about your dashboards or data. It can ripple out into your entire company, and even your personal life.
You can start small—by creating user stories, practicing intentional information design, and communicating clearly—but the impact will ultimately be big.
Shaun Davis, your personal data therapist, understands your unique challenges and helps you navigate through the data maze. With keen insight, he discerns the signal from the noise, tenaciously finding the right solutions to guide you through the ever-growing data landscape. Shaun has partnered for 10 years with top data teams to turn their data into profitable and efficiency hunting action. Learn more about Shaun.


