Action Bits
How Scaffolding Enhances Data Visualization in Tableau, SQL, and Excel
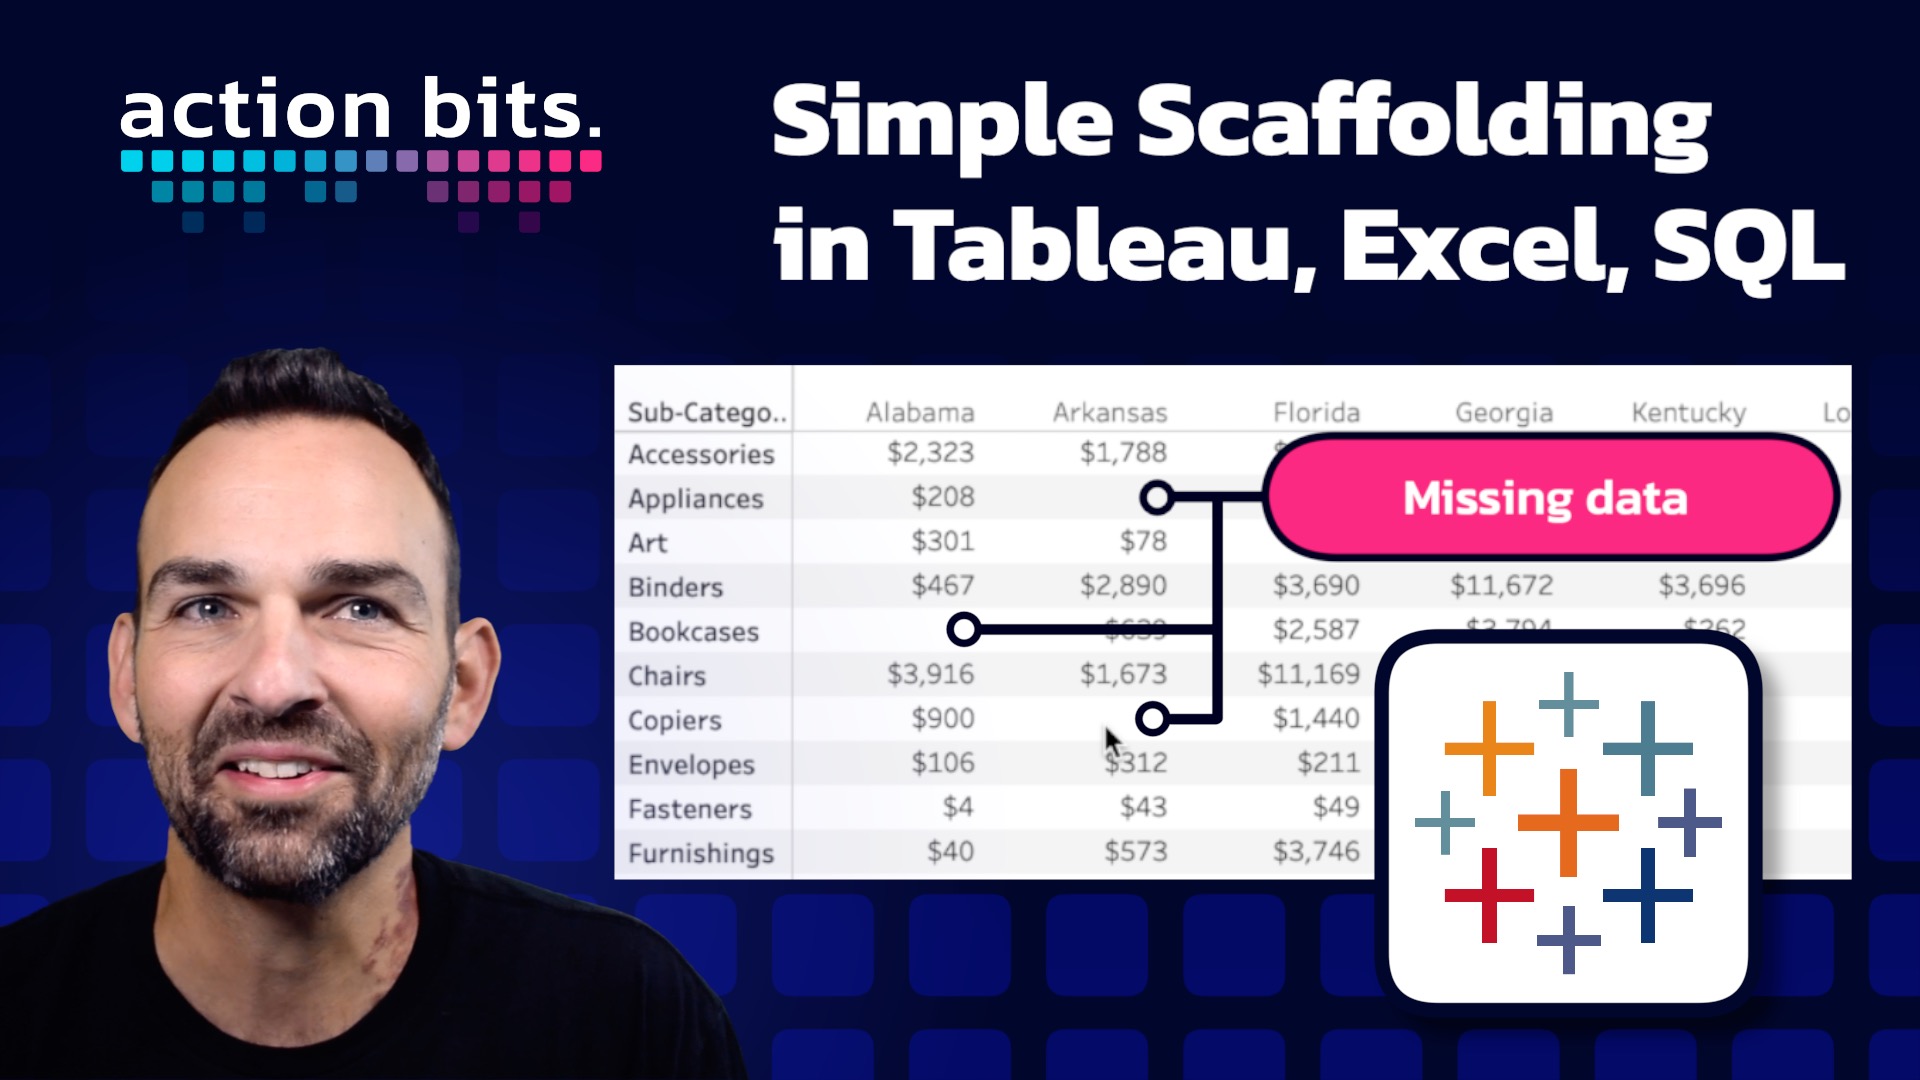
Missing data can create challenges for accurate reporting and decision-making. Whether in Tableau, SQL, or Excel, creating a robust, reliable dataset that accounts for every possibility in the data structure is crucial. Data scaffolding is invaluable for filling in data gaps and preventing blind spots. Below, we’ll explore scaffolding, its benefits, and practical applications in Tableau, SQL, and Excel.
What is Data Scaffolding?
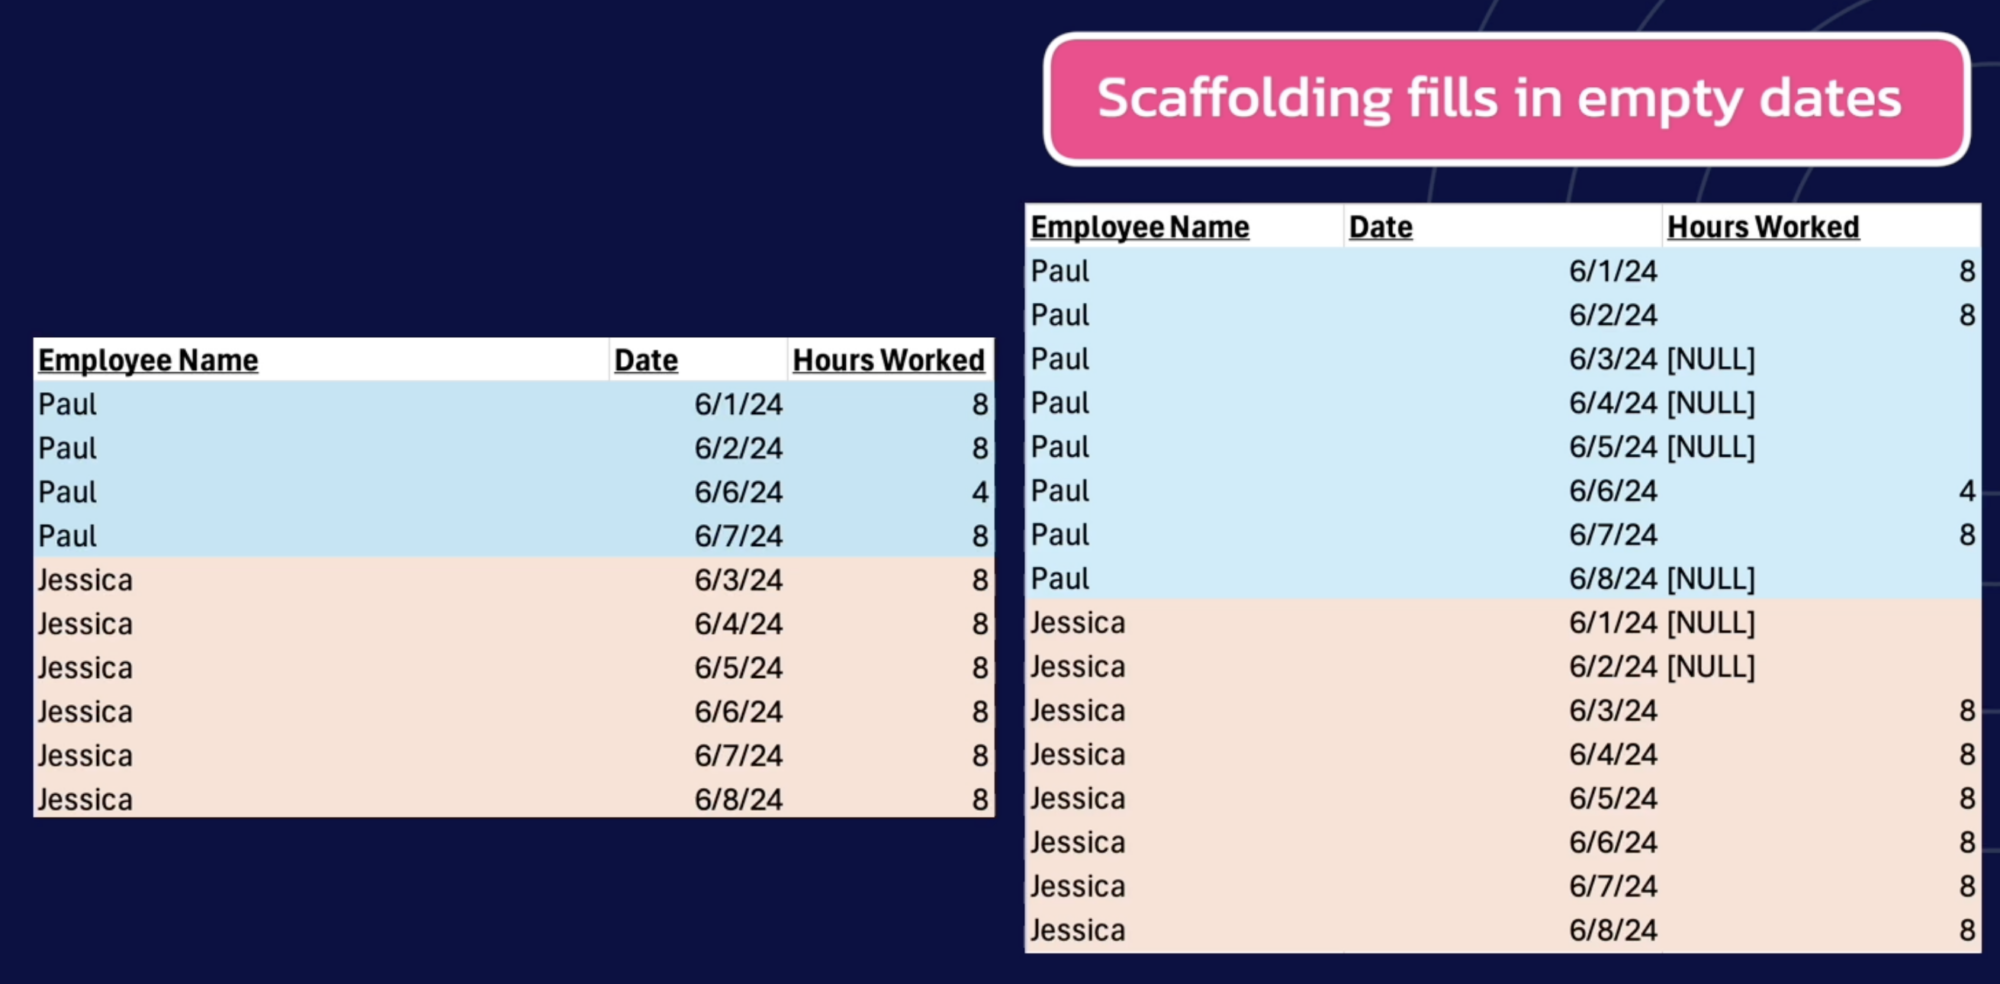
Data scaffolding is the process of structuring or expanding a dataset to represent every combination of chosen dimensions. Scaffolding ensures all data points are represented, even if some categories or dates are null. This provides a complete view, improving visualization quality and reliability.
Benefits of Scaffolding in Tableau, SQL, Excel
1. Filling In Missing Data: By scaffolding data, every potential combination of dimensions (e.g., region, state, or product category) is represented, even if some entries are naturally absent. This ensures no category or date goes unaccounted for in the final visualization.
2. Improving Analysis Consistency: With scaffolding, data analysis becomes more consistent and dependable because all possible outcomes are considered. This reduces the chance of erroneous conclusions drawn from incomplete data.
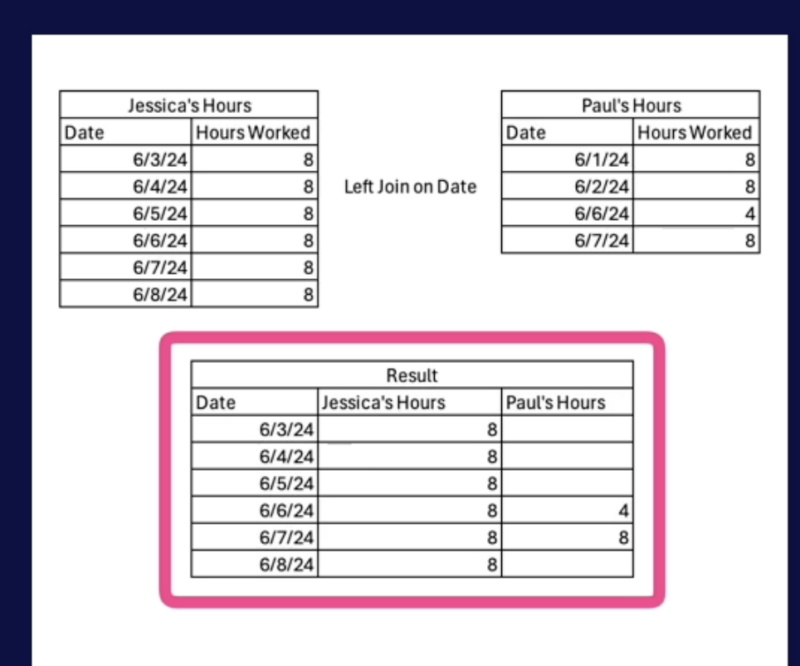
3. Reducing Join Errors in SQL and Tableau: Scaffolding helps in SQL and Tableau joins by structuring data in a way that minimizes mismatched or missing records, making data joins cleaner and more accurate.
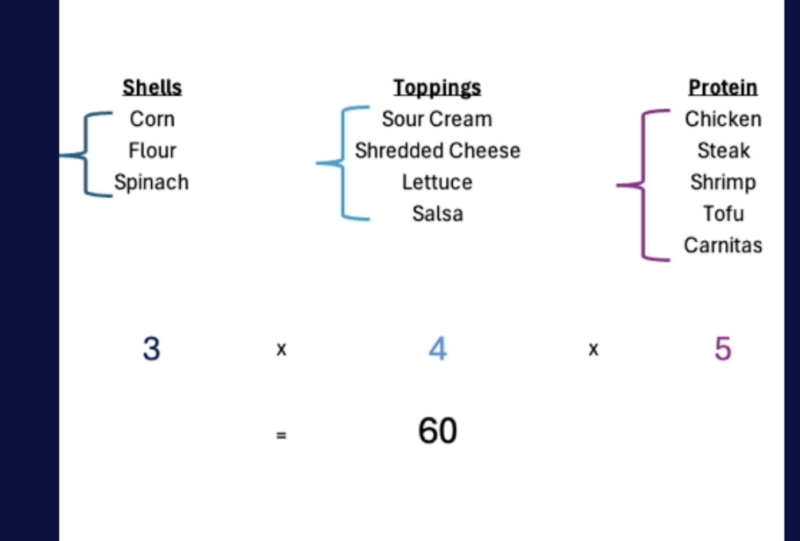
4. Predicting Data Combinations: Scaffolding allows analysts to calculate row counts by multiplying distinct values in each dimension. For instance, if analyzing tacos with 3 shell types, 4 toppings, and 5 proteins, scaffolding reveals 60 possible combinations, enhancing inventory and supply planning.
Scaffolding in Tableau
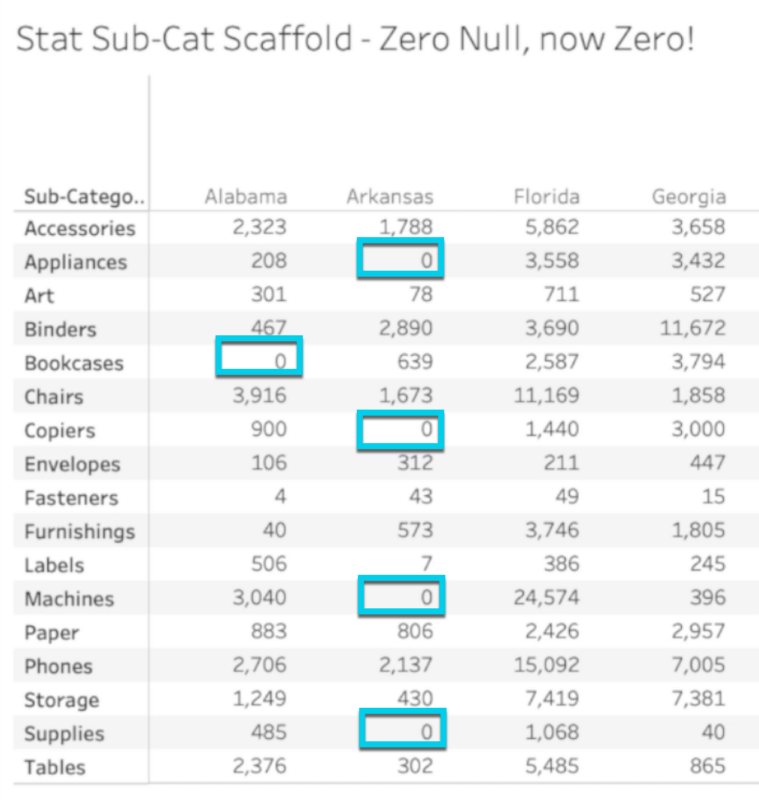
In Tableau Desktop and Tableau Prep, scaffolding can be implemented by first defining the dimensions (like region and state), finding their distinct values, and doing a cross-join to get every instance of those distinct combinations. Once this is done, previously missing data points, like a state with no sales for a certain product, can be handled by wrapping fields with a “ZN” (Zero Null) function to represent what was previously null values as 0. By scaffolding, Tableau users can display regions or categories even when they lack data, helping visualize gaps accurately.

Scaffolding with SQL
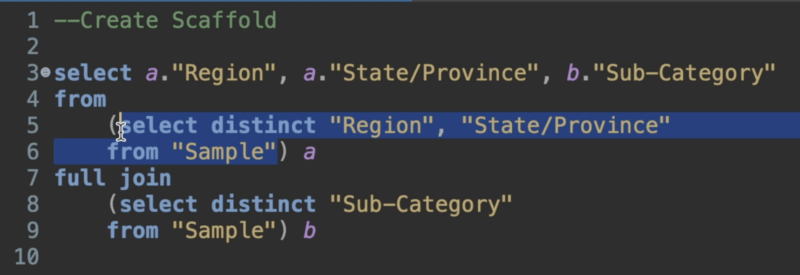
In SQL, scaffolding involves creating distinct lists of dimension values and joining them with original datasets to ensure every potential data combination is represented. SQL scaffolding scripts can simplify the process of producing comprehensive tables for analysis. For instance, using cross join calculations enables full data representation, making it easy to verify completeness in reports.
Scaffolding Techniques in Excel
Excel allows for straightforward scaffolding by creating lists of unique values for each dimension and combining them. This can be particularly helpful for smaller datasets or as a preparatory step before importing data into platforms like Tableau. By joining these scaffolded tables, analysts can handle missing data issues manually, ensuring the dataset is ready for analysis.
Practical Applications of Scaffolding
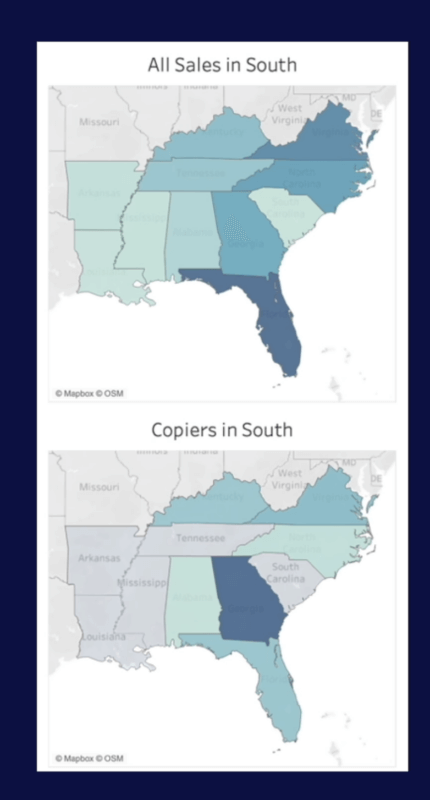
1. Sales Analysis Across Regions: Scaffolding is beneficial in Tableau to assess product sales by state, even if no sales occurred in certain states. This way, all regions are represented, offering a more accurate view of performance.
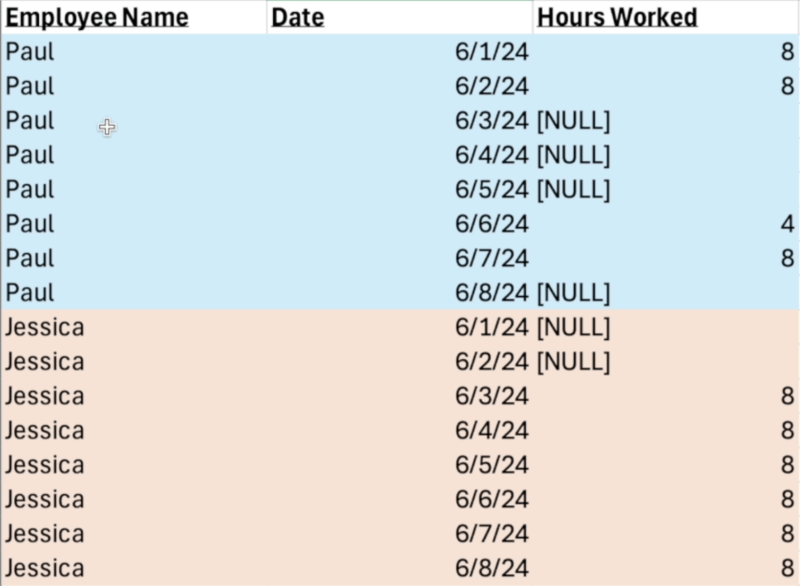
2. Employee Tracking: Scaffolding employee workdays ensures that all possible dates are represented, even if some employees did not work on certain days. This method fills gaps with null values, allowing managers to see work trends clearly.
3. Inventory and Supply Chain Management: By knowing all combinations of a product’s features, scaffolding helps in planning and predicting stock requirements, ensuring inventory is well-managed.
Scaffolding offers a structured approach to data visualization that fills in the gaps, reduces errors, and enhances analytical clarity. Whether using Tableau, SQL, or Excel, incorporating scaffolding techniques into your data workflow can greatly improve the accuracy and depth of your analysis.
So, next time you’re working with datasets that need that extra layer of reliability, try implementing scaffolding and see the difference it can make.
Want to learn more from the best in the business? Check out this Sensemaker’s episode where Jonathan Drummey does a deep dive on scaffolding in Tableau with maps.


