Data Visualizations
Visualizing Jimi Hendrix’s Unique Approach to Cover Songs
Jimi Hendrix, considered one of the most influential electric guitarists in the history of popular music, revolutionized the way the guitar was played and perceived in rock music. Born on November 27, 1942, in Seattle, Washington, Hendrix’s career, though remarkably short-lived, left an indelible mark on the music world and popular culture.
Hendrix’s innovative approach to the electric guitar, characterized by his use of feedback, distortion, and expressive use of the whammy bar, pushed the boundaries of what was musically possible at the time. His mastery over the instrument allowed him to create sounds that were unprecedented, blending rock, blues, jazz, and funk into a unique fusion that has influenced countless musicians.
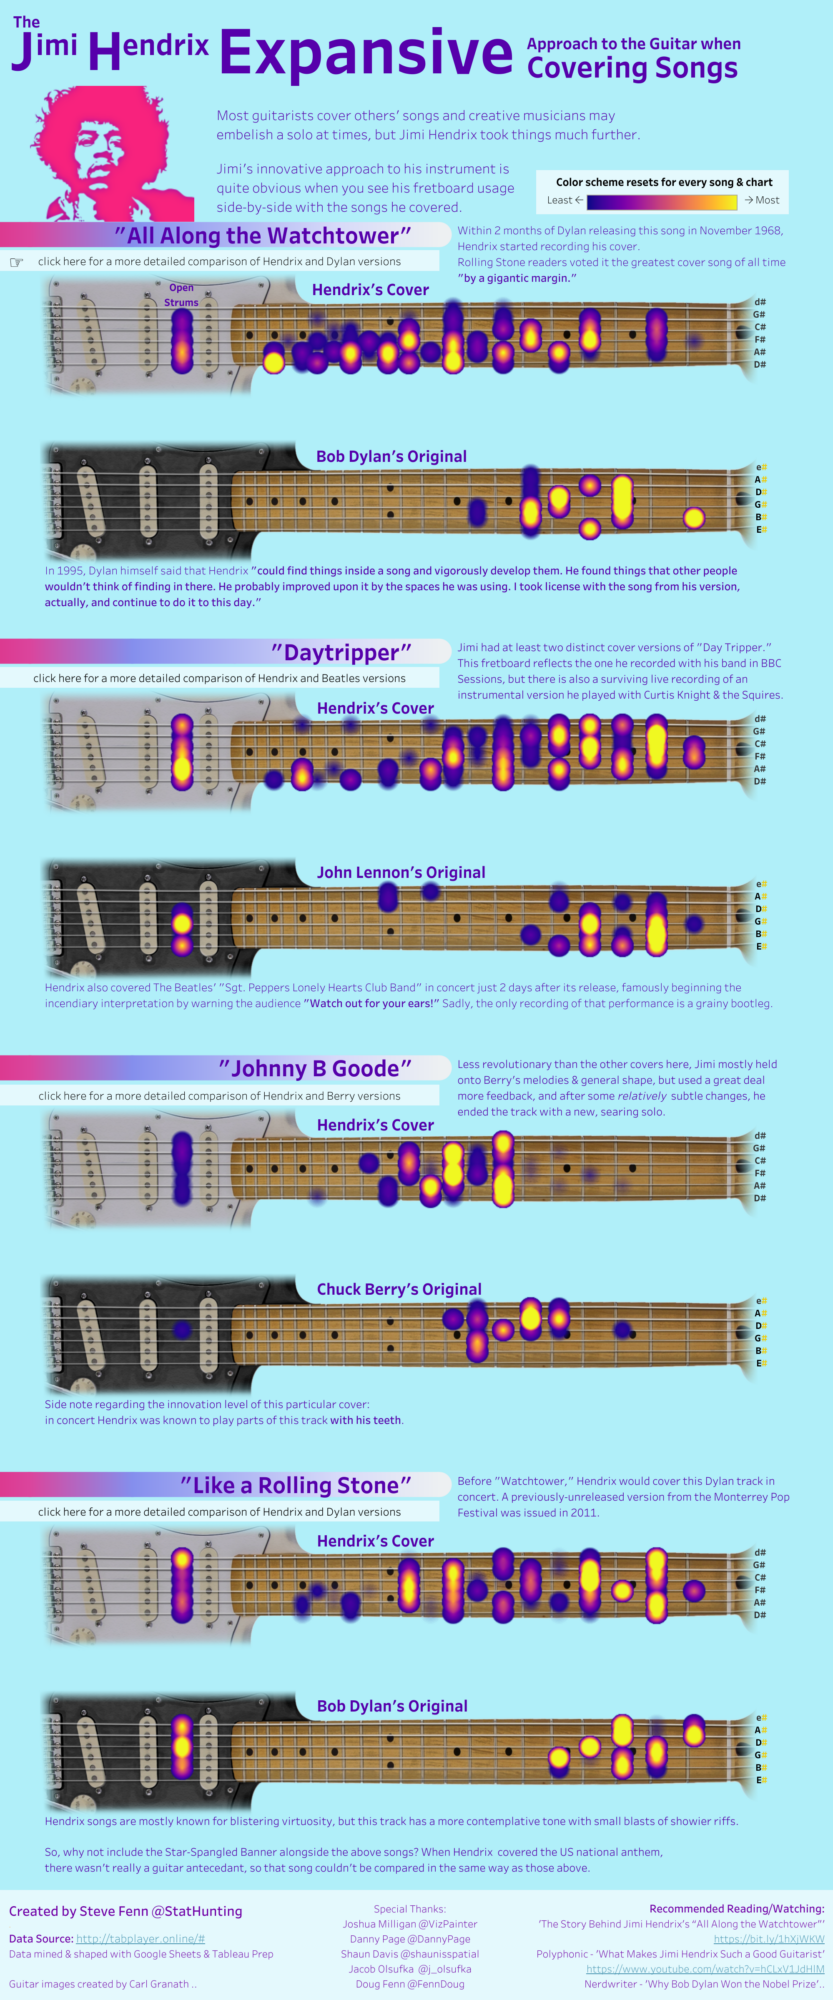
Jimi Hendrix’s approach to covering songs was highly innovative, often transformative, setting his versions apart from the originals in significant ways. His unique treatment is evident in his choice of guitar tuning, his use of the fretboard, and his overall interpretative style, which often involved significant embellishments and improvisations.
[Click on the image to interact with the Tableau dashboard] I created this dashboard because I’ve always enjoyed listening to musicians’ interpretation of other artists, and I realized that I could take guitar tablatures, shape them into well-structured data, and then create heatmaps to visually compare the original and cover versions of each song.
The Hendrix cover of Dylan’s All Along the Watchtower was the first song that came to mind in this endeavor, then I realized his lesser-known covers of Daytripper, Johnny B. Goode, and Like a Rolling Stone added interesting context in demonstrating the data behind Hendix’s creative approach.
[Hendrix cover image by iStock.]


