Newsletters
Predictive Analytics: Your Guide to Seeing the Future
Analytics Advantage is a weekly newsletter of actionable insights, proven strategies, and top tips for getting the most from your data and making high-stakes decisions with confidence. Here’s a recent sample. We hope you’ll subscribe.
***
How do we predict what’s going to happen in business? By using the past, of course! This week, we peer into the murky and uncertain world of predictive analytics.
Let’s hop into our TARDIS and see what’s to come.

A Quick Note About Me and THE MATHS
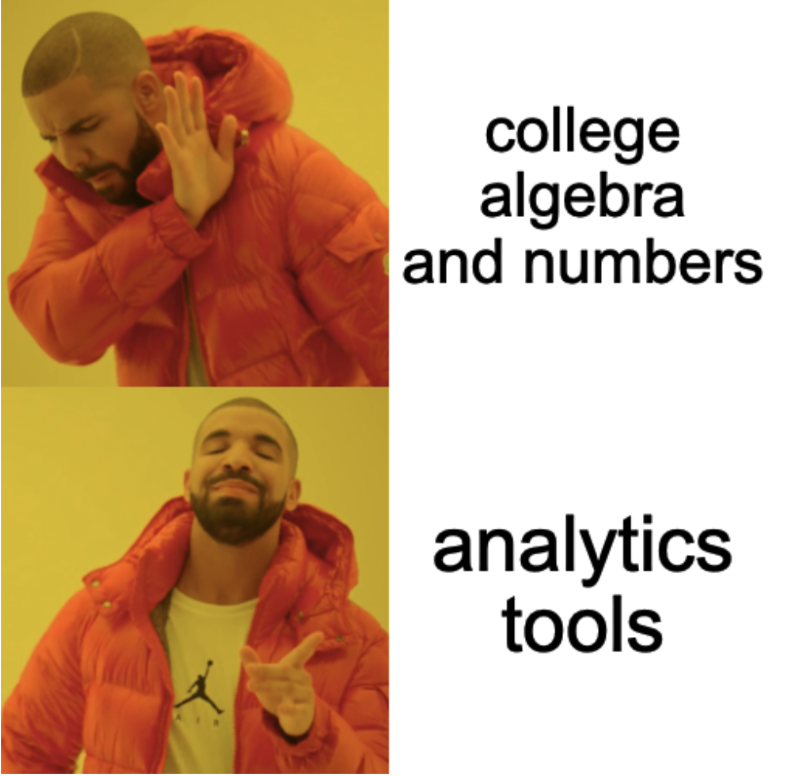
I’m not great at math. I failed high school and college algebra (at least once). When I hear numbers read to me, I struggle to keep track. Surprisingly, this is one of the things that led me to tech and analytics. I rely on tools to help make sense of those jumbles of numbers.
Not a shocker, but predictive analytics relies heavily on math that I don’t fully understand. So, this article focuses on the applications of data science and machine learning, not the nuts and bolts of the algorithms themselves.
Thankfully, Action and my client companiess are full of experts who deeply understand this stuff. I rely on them for content and in applying data science solutions.
With that said, onward into The Matrix….

Where Companies Use Data Science
A lot of data and analytics focuses on answering the question: “What happened?”
There are good reasons for this, which we’ll get into later. But, predictive analytics goes further, aiming to answer: “What’s going to happen?”
Here’s where I see companies applying predictive analytics most often:
Marketing: Predicting Sign-Up Rates
When consumers see an offer, some respond quickly, while others act days or even weeks later.
Data scientists often collaborate with marketers to predict what the final sign-up rate will be at a future point. These models help optimize advertising spend and maximize results.
Finance: Predicting Future Revenue
Finance teams rely on predictive models to forecast revenue, answering questions like: “Based on our historical performance and market trends, how much revenue should we expect next month, quarter, or year?”
Sales: Customer Lifetime Value
Not all customers are created equal. Sales teams often build CLV models, combining metrics like average spend, churn rate, order frequency, and profit margins to estimate how much a customer will contribute over their relationship with the company.
Customers or Personas with higher CLVs justify more attention and resources, since they’re likely to contribute more to revenue.
Operations: Staffing
Operations teams use predictive analytics to estimate staffing needs and budget requirements, ensuring the company runs smoothly without overspending.
Executive: Revenue Guidance
While not required to, some companies provide revenue guidance during earnings reports, based on predictive models. While there’s legal protection if they miss projections made in good faith, inaccurate assumptions can lead to costly regulatory issues.
The Ingredients: Quality, Documented Data
Data science relies on the past to predict the future. For many companies, the biggest hurdle is building a data ecosystem that’s timely, accurate, consistent, accessible, and well-documented.
Simply put: If you don’t trust the data about what’s happened, how can you trust what it predicts about the future?
The Uncertain Science
How much do you trust the analytics your car produces? Every time you hit the road, your car performs a form of data science. For example, “Miles to Empty” is calculated using the gas in your tank and a regression analysis of your miles per gallon—or maybe just a simple rolling average.
Similarly, “Estimated Time of Arrival” is based on the distance to your destination and your average speed. These metrics are great gauges (get it? Car…Gauges…sigh…anyhoo) of your comfort with uncertainty.
Organizations, like people, have varying levels of comfort with uncertainty and risk.
Inherent in data science is uncertainty. When a data scientist displays a number with two or three decimal places, it might look precise. But beneath that seemingly exact figure lies an ocean of assumptions and probabilities.
Think back to your car. How much uncertainty are you comfortable with for “Miles to Empty?” Is a buffer of 30 miles okay? What about 25? Or 5? The risk here is clear: if that prediction is wrong, you could end up stranded.
Now, consider the “Estimated Time of Arrival.” It’s usually accurate within 10 to 15 minutes, but the closer you get to your destination, the less it matters.
Organizations operate in much the same way. Data scientists need to communicate their assumptions and the range of possible outcomes more effectively. Unfortunately, many people—and organizations— struggle with understanding probabilities. For example, what does a 95% confidence interval really mean?
How well you or your organization understands these concepts directly impacts how successfully you’ll apply data science.
The Products of Data Science
While Data Scientists don’t produce Frankenstein-like creatures terrorizing Bavarian villagers, they do stitch together a specific set of products. Their products most often look like:
- A set of finite numbers
- A model which is incorporated into a product
- Optimization strategies
- Written guidance on how to make operations more efficient
And the categories of those products typically fall into these buckets:
- Forecasts: Predicting a metric into the future based on the past
- Guidance: Actions the business can take to grow or improve efficiency
- Prioritization: A ranking of customers, projects, etc
Bringing It in for a Soft Landing
Data science, and its successor, artificial intelligence, hold a world of possibilities. But, it all comes back to two critical factors: high-quality, governed data and a strong comfort with uncertainty.
Apply this correctly, and you will beat the competition for years to come!
Closing Thoughts
Predictive analytics and data science hold so much potential, but it always comes back to the basics: high-quality, trustworthy data and a healthy dose of comfort around uncertainty. Without those, you’re just making guesses with fancy math.
And let’s not forget the importance of cutting through the noise. Too much jargon gets in the way of the real goal: creating actionable insights that actually help people. Predictive analytics isn’t just about predicting the future—it’s about helping you make smarter decisions today.
When used correctly, these tools give you the power to not just see what’s ahead, but to shape it. Now the question is: What’s your next move?
Bonus: Your Data Science Decoder Ring
Predicting the future with math often introduces a massive “word salad” into the process. Many practitioners use these terms in ways that obscure what’s actually happening in their predictions. This overuse of jargon creates a significant barrier to broader and more effective use of predictive analytics.
To help, here is a list of terms you might run across:
Core Analytics Terms:
- Predictive Analytics: Uses historical data to forecast future outcomes.
- Prescriptive Analytics: Analyzes data to recommend optimal actions.
Artificial Intelligence and Machine Learning:
- Artificial Intelligence: Enables machines to perform tasks without explicit programming.
- Machine Learning: AI subset developing algorithms to identify patterns.
- Large Language Models: AI models trained on text to generate human-like language.
Common Machine Learning Models and Techniques:
- Neural Network: AI inspired by the brain to recognize patterns.
- Random Forest: Learning method aggregating multiple decision trees for improved predictions.
- Generative AI: Creates new content by learning from existing data patterns.
Key Statistical and Modeling Concepts:
- Regression: Predicts continuous outcomes by modeling variable relationships.
- Classification: Categorizes data into discrete groups.
- Clustering: Groups similar data points without predefined labels
- Dimensionality Reduction: Simplifies datasets by preserving critical information.
Model Development and Evaluation:
- Hyperparameter Tuning: Optimizes model configuration for better performance.
- Overfitting/Underfitting: Balancing model complexity for effective generalization.
- Cross-Validation: Evaluates model performance across different data subsets.
- Bias-Variance Tradeoff: Manages accuracy and generalization balance.
Practical Applications:
- A/B Testing: Compares variables to identify better performance.
- Data Pipeline: Prepares data through extraction, transformation, and loading (ETL).
Visualization and Performance Metrics:
- ROC Curve: Evaluates classification model performance by balancing true and false positive rates.
Shaun Davis, your personal data therapist, understands your unique challenges and helps you navigate through the data maze. With keen insight, he discerns the signal from the noise, tenaciously finding the right solutions to guide you through the ever-growing data landscape. Shaun has partnered for 10 years with top data teams to turn their data into profitable and efficiency hunting action. Learn more about Shaun.


