Newsletters
Preparing for the Big Meeting? Dig Deeper

Analytics Advantage is a weekly newsletter of actionable insights, proven strategies, and top tips for getting the most from your data and making high-stakes decisions with confidence. Here’s a recent sample. We hope you’ll subscribe.
***
We’re excited to have a special guest editor of Analytics Advantage this week: Jeremy Paytas, a colleague of Shaun Davis at Action. Like Shaun, Jeremy is a seasoned analytics leader with a passion for uncovering meaningful insights hidden in data. In this issue, he shares a powerful strategy in preparing for high-stakes meetings, one that goes beyond dashboards and surface-level numbers.
[Scene 1]: The Moment of Truth
You step into the boardroom, scanning the room as executives settle in, coffee in hand, ready to see the numbers. This is your moment—the culmination of all those long nights spent analyzing data, building dashboards, and refining your insights. You take a deep breath. You’re not sweating it. You’re confident. You’re more than ready.
Why? Because you didn’t just skim the numbers—you dug deeper.
Digging Deeper – Root-Cause Analysis
The typical approach in preparing for a meeting is to go through your myriad dashboards that illustrate the performance metrics driving your business, product, or department. On the surface, it’s easy to say something like, “Our sales are better than last year by X percent,” or “We didn’t quite meet our target numbers by X.” While those statements may be true, real insights require going deeper.
Early in my career, a mentor, Greg Rentch, shared a key secret to success:
Always ask the next “why?”
It’s not enough to show the obvious. If your data visualizations are strong, anyone can see that sales are rising or falling. The real value comes from understanding why those numbers look the way they do. And don’t stop at the first “why”–push further until you reach five.
(The Five Whys technique developed by Sakichi Toyoda, was a cornerstone of Toyota’s manufacturing success.)
The 5 Whys in Action
This technique offers a structured approach to diagnosing problems. Consider this classic example:
Problem: Bolts are cross-threading in an engine block on the production line.
- Why? The threads aren’t cut cleanly.
- Why? The cutting tool wasn’t changed today.
- Why? The replacement cutting tool bin was empty.
- Why? The bin’s contents have fallen under the shelves.
- Why? A rusted shelf leg failed, making the shelves unstable and causing the tools to spill.
Now, let’s apply this to your business:
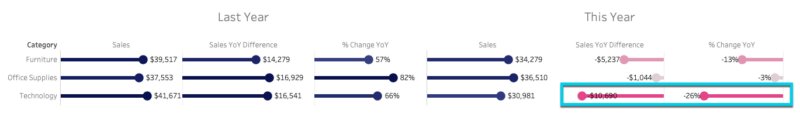
Problem: Sales are down year-over-year by X-percent.
- Why? The sales team’s performance has dropped.
- Why? There’s been high turnover.
- Why? It’s been hard to retain experienced talent.
- Why? Competitors are poaching our top performers.
- Why? Industry analysis shows we aren’t compensating competitively.
[Scene 2:] The Boardroom Test
Your presentation begins. You confidently walk through the high-level figures—those attention-grabbing BANs (Big Ass Numbers). Just as expected, a hand shoots up.
“This is all fine and dandy, but why are sales down in the Central Region?”
You smile. This is exactly the question you were waiting for.
“I’m glad you asked.”
Because you’re prepared.
You’re able to share the visualizations and story that helps back up your numbers:
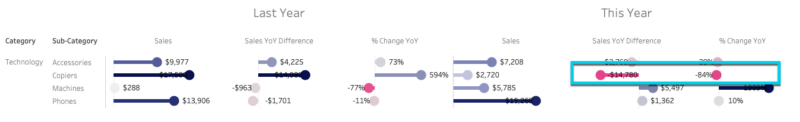
Why are Central Region sales down year over year?
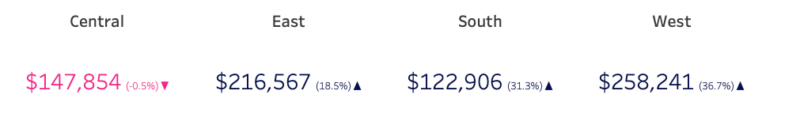
Why? Sales have slipped in certain states.
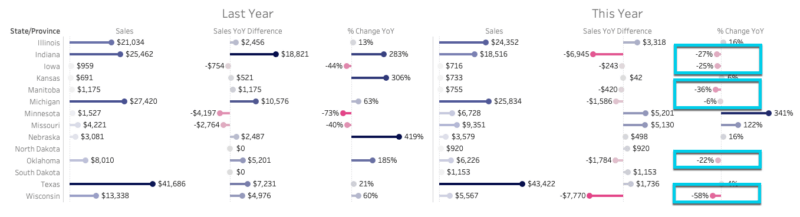
Why? Decrease in technology for those states.
Why? Copiers and accessories have underperformed.
Why? Canon is struggling in copier sales.
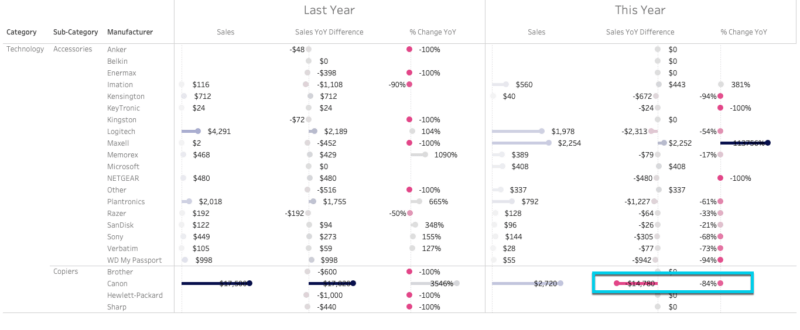
Why? Canon ImageCLASS 2200 Advance Copier sales have plummeted to zero!

Now the executives understand the story behind the numbers. Armed with deeper insights, they can take action, whether that means adjusting strategy, shifting investments, or engaging with suppliers.
[Scene 3:] The Payoff
Executive: “It’s clear you’ve done your homework. You’ve gone beyond the surface-level metrics and uncovered key business drivers.”
Maybe the meeting won’t end with a promotion on the spot—but one thing is certain:
You’ll stand out as someone who gets it.
You’re not just presenting data, you’re bringing clarity, insight, and strategic direction.
Beyond the 5 Whys: More Digging-Deeper Tools
While the 5 Whys technique is a powerful starting point, it’s not the only tool in your toolbox. Here are a few more techniques to help refine your analysis:
Fishbone (Ishikawa Diagram) – A structured brainstorming tool for mapping all potential factors contributing to a problem. Try Miro’s template: Fishbone Diagram.
Mind Mapping – Unlocks creativity and visualizes complex relationships. Explore Miro’s templates: Mind Map.
User Interviews – Talking directly to stakeholders and customers directly can uncover hidden insights. Learn more: User Interview Guide.
So, the next time you’re prepping for that big meeting, don’t just bring numbers–bring answers! Dig deeper and watch your insights turn heads.
Signing off,
Shaun Davis, your personal data therapist, understands your unique challenges and helps you navigate through the data maze. With keen insight, he discerns the signal from the noise, tenaciously finding the right solutions to guide you through the ever-growing data landscape. Shaun has partnered for 10 years with top data teams to turn their data into profitable and efficiency hunting action. Learn more about Shaun.