The Sensemakers
Unlocking Insights: Lessons from Our “Design of Everyday KPIs” Series
Businesses thrive on their ability to interpret, analyze, and act on metrics that reflect their company’s performance. However, the design, implementation, and interpretation of Key Performance Indicators (KPIs) remain a challenge for many organizations. Robert Rouse’s “Design of Everyday KPIs” series on The Sensemakers is something of a masterclass in not only creating meaningful KPIs, but also in establishing scalable systems that ensure clarity, efficiency, and long-term sustainability.
In this article, we’ll distill some of the key takeaways from the KPI series and look at how these lessons can transform your organization’s approach to KPI management.
Episode 1: Building Blocks of KPIs
Watch the video:
Key Takeaways:
- KPI Structure Matters: KPIs should follow a structured format—Prefix (e.g., $, %), Value (numeric result), and Suffix (units, trend indicator).
- Context is Critical: Comparisons (e.g., year-over-year, month-to-date) give meaning to raw numbers.
- Avoid String Conversions: Instead of converting numbers into strings for presentation, maintain numeric values for efficiency in dashboards.
- Focus on Trends Over Snapshots: Trendlines and historical comparisons provide deeper insights than static up/down arrows.
How This Impacts Your Business:
A well-structured KPI ensures clear communication of results to stakeholders. Trend-based KPIs help businesses anticipate problems before they become crises. Optimizing dashboards to use numeric rather than string operations drastically improves performance and responsiveness.
Episode 2: KPI Glossaries – The Unsung Hero of Analytics
Watch the video:
Key Takeaways:
- Centralized Definitions: A KPI glossary serves as a single source of truth for metric definitions, business logic, and metadata.
- Accessible Documentation: Avoid burying definitions in obscure repositories; integrate them directly into dashboards and workflows.
- Dynamic Updates: Glossary updates propagate across dashboards, ensuring consistency without repetitive manual changes.
- AI-Readiness: Glossaries with natural language descriptions prepare organizations for AI-driven analytics tools.
How This Impacts Your Business:
A KPI glossary eliminates ambiguity, especially in large organizations where different departments may define metrics differently. By integrating glossary metadata into dashboards, analysts save time and reduce the risk of misinterpretation. Furthermore, this approach ensures your organization is ready for future AI-based analytics integrations.
Episode 3: Merging Data Silos with a KPI Layer
Watch the video:
Key Takeaways:
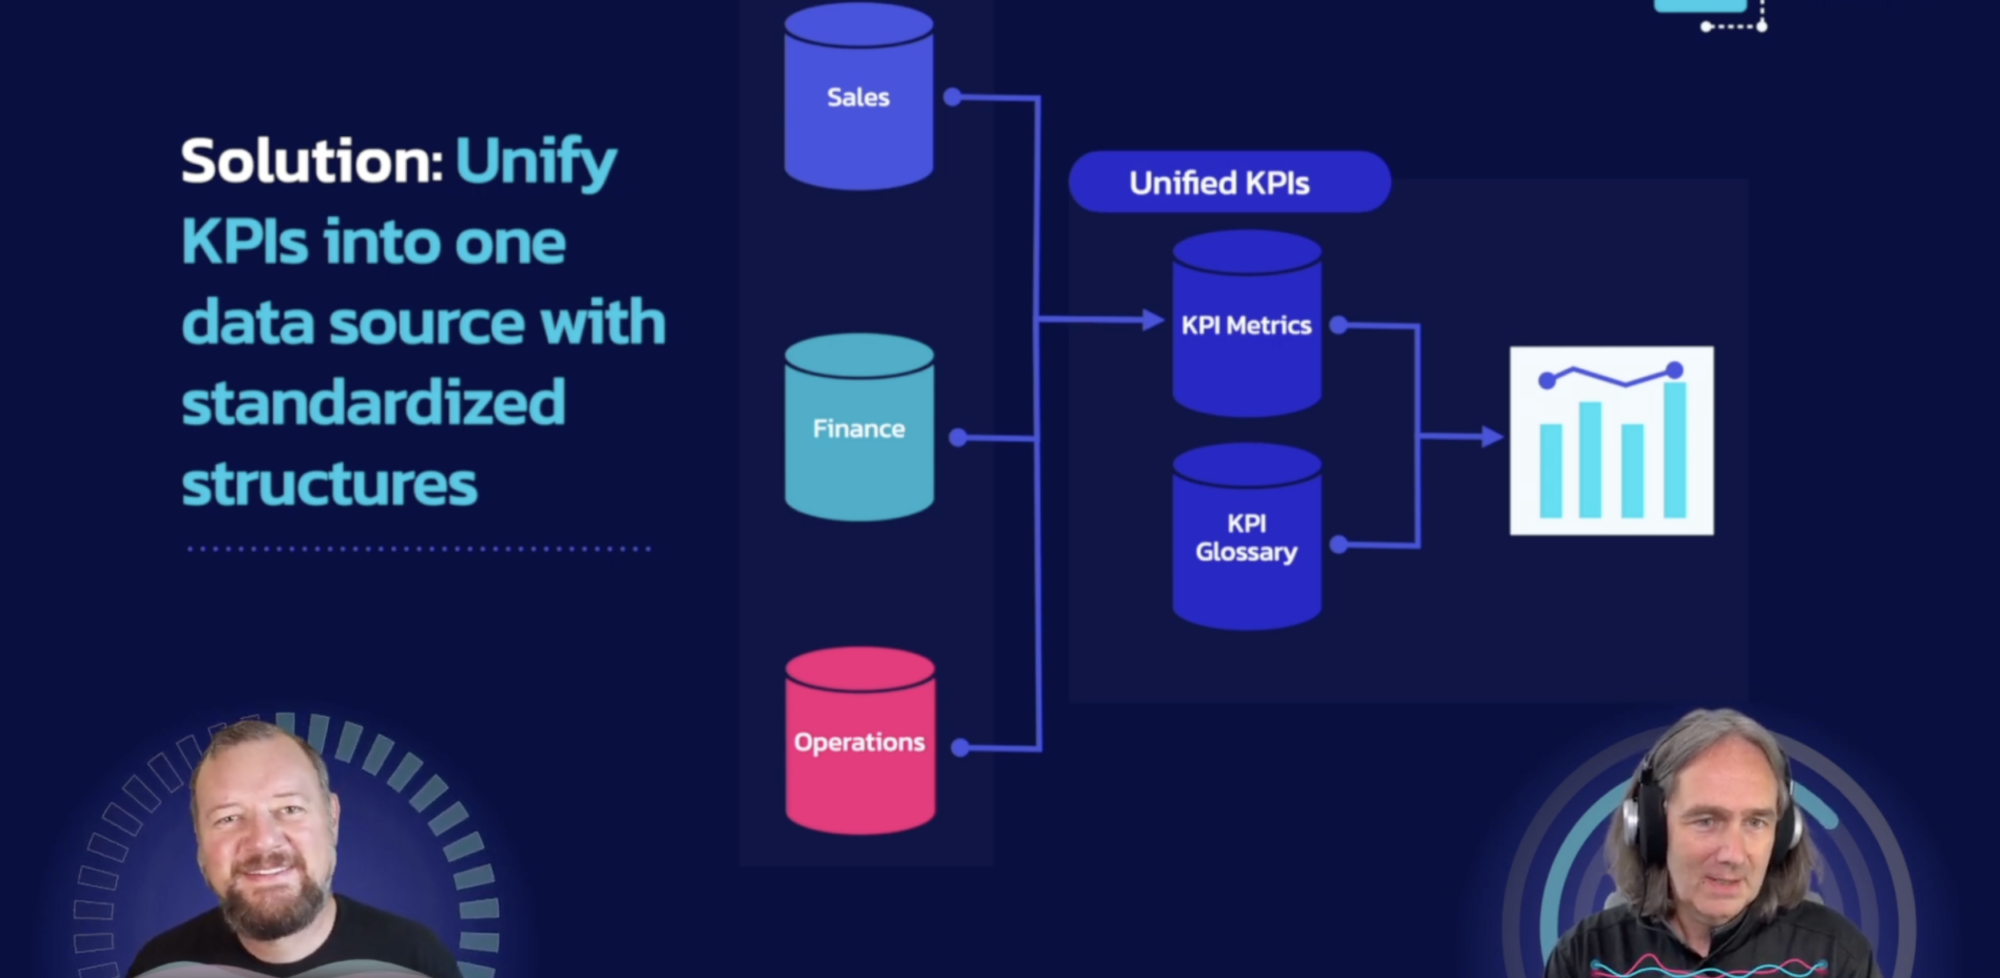
- Unified KPI Layer: Combine data from sales, finance, and operations into a single, harmonized structure.
- Stacked Row Format: Shift from column-based to row-based KPI structures using IDs, numerators, and denominators for flexibility.
- Subtotals and Aggregations: Use techniques like group-by-rollup to manage subtotals and regional aggregations without duplications.
- Snapshot Mechanisms: Capture periodic KPI snapshots for historical comparisons and better data transparency.
- Time Granularity: Accommodate metrics recorded at different time intervals—monthly, quarterly, yearly—within the same structure.
How This Impacts Your Business:
A unified KPI layer eliminates silos, providing both leadership and dashboard teams with a clear, cross-departmental view of the organization. It not only supports leadership presentations but also reduces maintenance costs and enhances reporting flexibility for those building and maintaining dashboards. Pre-aggregations combine multiple large data sets into a single, streamlined set, significantly reducing query and render times while easing the computational load on dashboards. Snapshot capabilities enable precise historical audits and performance tracking.
Top 5 Lessons from the Series
- Structure is Everything: Whether it’s designing KPIs, creating glossaries, or merging data silos, structure and consistency are key.
- Integrate Documentation into Workflows: Glossaries and metadata should be accessible directly from dashboards, not buried in document repositories.
- Think Long-Term: Design dashboards and KPI structures with future scalability in mind. Avoid technical debt by using repeatable patterns.
- Efficiency in Design: Avoid performance bottlenecks caused by inefficient string conversions or redundant calculations.
- Prepare for AI Analytics: Glossaries and structured KPI layers create a strong foundation for future AI integration.
How These Ideas Can Transform Your Business
1️⃣ Improved Decision-Making:
Clear, well-structured KPIs enable leadership to make informed decisions faster.
2️⃣ Reduced Technical Debt:
By standardizing structures and using dynamic glossary updates, you reduce the risk of outdated or incorrect data propagating across dashboards.
3️⃣ Scalable Analytics:
Adding a new KPI becomes a matter of adding rows rather than redesigning entire dashboards.
4️⃣ Cross-Departmental Collaboration:
A unified KPI structure facilitates better collaboration and shared understanding between sales, operations, and finance teams.
5️⃣ AI-Readiness:
As AI analytics tools become standard, organizations with structured KPI layers and dynamic glossaries will have a significant competitive advantage.
Practical Steps to Implement These Ideas:
- Audit Your Current KPIs: Ensure they follow the prefix-number-suffix structure.
- Create a Central KPI Glossary: Document definitions, logic, owners, and update protocols.
- Standardize KPI Formats Across Departments: Use the stacked row-based KPI format for scalability.
- Set Up Snapshot Mechanisms: Implement regular snapshot captures for historical comparisons.
- Train Teams: Educate analysts and business users on how to access and utilize KPI glossaries effectively.
The KPI Advantage
The “Design of Everyday KPIs” series provides not only theory, but actionable strategies for structuring KPIs, creating accessible glossaries, and merging disparate data sources. These principles aren’t just relevant for analytics teams, they’re transformative for entire organizations.
Investing time in building strong KPI structures, maintaining clear glossaries, and unifying data silos doesn’t just improve dashboard aesthetics; it empowers decision-makers, boosts operational efficiency, and prepares organizations for future advancements in AI and analytics.
If your business relies on KPIs (and let’s face it, every business does), implementing these strategies is not optional—it’s essential.


