Newsletters
23 Ways to Gain the Analytics Advantage
Behind every dashboard, metric, and automation is a set of hard-won lessons about what really moves the needle in turning data into action. Here are 23 insights gleaned from our weekly Analytics Advantage newsletter, edited by Shaun Davis.
These insights come from real-world circumstances and how we at Action approach our company and our work with clients. Consider this your field guide to working smarter, not harder. From dashboard clarity to predictive analytics, here’s a list of recommendations for unlocking your data advantage.
1. Define Your Goals Like a Pro
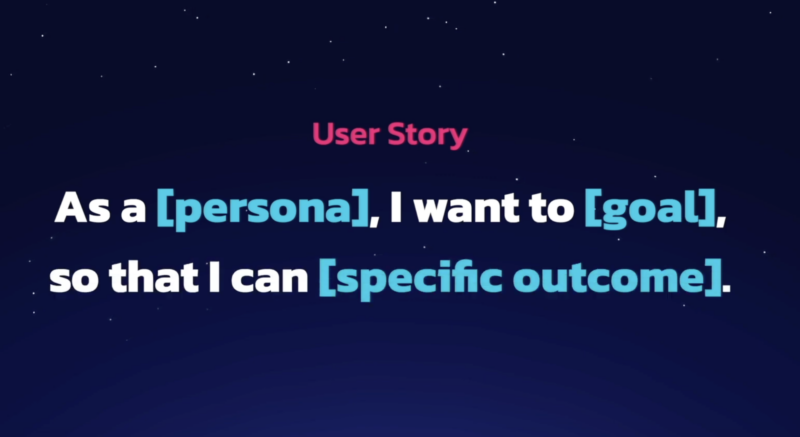
Great data work starts with organizational clarity. User stories force teams to define clear intentions and reduce confusion across systems.
Pro Tip: Map out the acceptance criteria and success influences up front. It’s the cheapest time to get it right.
From: How Business Organization Can Boost Your Data Efficiency
2. Automate What Matters–Not Everything
Automation is only valuable when you’re solving the right problem. Focus on stable, repetitive tasks and always do the task manually first to understand it more deeply.
Pro Tip: Before automating, walk through the process with stakeholders to clarify assumptions and avoid wasted effort.
From: To Automate or Not To Automate
3. Kill Data Friction
The time spent reshaping, cleaning, and merging data is often invisible, but costly. Map the full path from raw data to decision-making to identify where optimization can happen.
Pro Tip: Track the time you spend on data prep. What gets measured gets improved.
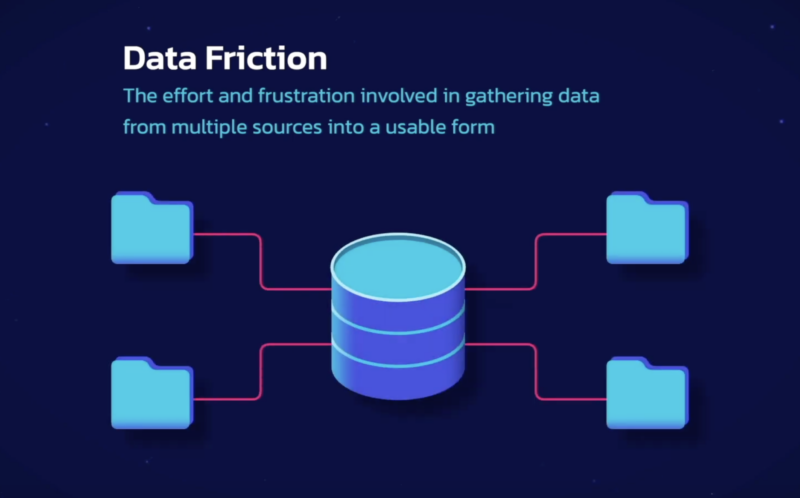
From: How to Remove Data Friction
4. Build Purpose-Driven Data Products
If your dashboard doesn’t answer a clear business question, it risks the “So what?” problem. Get close to end users and design only what truly drives action.
Pro Tip: Ask “What decision will this dashboard influence?” before designing a single chart.
From: So What? When Your Product Doesn’t Matter
5. Use Data to Improve Yourself, Too
Personal development thrives on small, measurable wins. Identify one “North Star” metric for growth, and track it consistently, even when life throws you curveballs.
Pro Tip: Track for consistency, not perfection–especially when building habits.
From: Data for a Better Life
6. Let Visualization Speak for Itself
If someone needs a guide to read your chart, it’s not a good chart. Embed context directly into visuals and remove clutter until only insights remain.
Pro Tip: Show your dashboard to someone unfamiliar with the project. If they can’t explain it back to you in 30 seconds, simplify.
From: How Data Visualization Empowers Smarter Business Decisions
7. Treat Feedback Like Data (Because It Is)
Customer feedback is a goldmine. Use AI tools to analyze it and create structured insights that shape smarter product and process decisions.
Pro Tip: Turn support tickets, survey comments, and review snippets into a feedback corpus for regular analysis.
From: How Feedback Can Shape Better Data Solutions
8. Drive Vendor Adoption Through Design
Prevent outside partners from disrupting your operations by building independent data models and setting crystal-clear expectations through SLAs and pilot programs.
Pro Tip: Pilot with one team, then document what went wrong. Use that list to harden your rollout plan.
From: Driving Change: Effective Strategies for Vendor Process Adoption
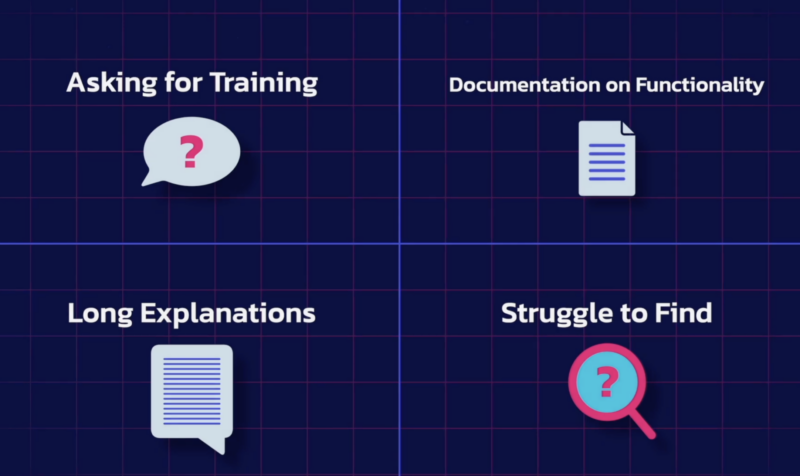
9. Your Dashboard Shouldn’t Need a Tour Guide
If dashboards require training, something’s wrong. Strip away complexity, embed clear labels and filters, and test with users to ensure intuitive design.
Pro Tip: Before launch, give users five questions to answer using the dashboard—without your help.
From: I’m Tired of Explaining Dashboards
10. Predict What’s Next (Responsibly)
Predictive analytics unlocks proactive decisions—if the data is clean and the business questions are focused. Start small (e.g., churn prediction) and scale only what works.
Pro Tip: Start with one use case (like churn) and one model. Measure accuracy and business impact before scaling.
From: Unlocking the Power of Predictive Analytics: Your Guide to Seeing the Future

11. Track the Trends That Matter
AI, sustainability metrics, and unified data ownership are shaping the future of analytics. Get ahead by investing in data governance and testing small AI experiments.
Pro Tip: Assign a team member to monitor and report on emerging data trends quarterly—it pays off.
From: Emerging Trends in Analytics for 2025 and Beyond
12. Don’t Let Vendors Own Your Data Logic
Building your own models allows for tailored insights, flexible adaptation, and long-term resilience. Translation layers can help absorb external system changes without chaos.
Pro Tip: Build a translation layer between vendor data and your model logic—it’s the firewall that keeps your system stable.
From: Driving Change: Effective Strategies for Vendor Process Adoption
13. Align Teams Around Real Metrics
Define growth-focused metrics that everyone can rally behind. Avoid vanity metrics and ensure leaders are accountable for using data to drive progress.
Pro Tip: Publish a shared glossary of key metrics with owners, definitions, and business value. Review it quarterly.
From: Aligning Teams Around Key Metrics
14. Turn Feedback Into a Strategic Engine
Feedback is more than support tickets—it’s a strategic asset. Make it visible across all teams and use it to map out the customer journey and improvement priorities.
Pro Tip: Turn customer quotes into team discussion prompts during planning sessions. Start with: “What are we hearing most often?”
From: Listening to Your Customers
15. Learn From Data Disasters
Zombie code, unit mix-ups, and unchecked assumptions have sunk billion-dollar missions (literally). Regularly audit for technical debt and implement fail-safes for high-stakes data projects.
Pro Tip: Schedule a quarterly “data horror stories show-n-tell” where teams share past mistakes and how they fixed them.
From: Spooky Data Horror Stories
16. Simplify Your Visuals to Maximize Impact
Visual clarity is a leadership issue. Don’t confuse detail for depth–clean, focused visuals reveal insight faster and more reliably.
Pro Tip: Ask: “What would this look like if it were a road sign?” Visuals should be just that clear.
From: How Data Visualization Empowers Smarter Business Decisions
17. Start Every Project With a Plan
Data products without defined outcomes waste time. Tie analytics efforts to specific personas and high-impact business goals from day one.
Pro Tip: Rank proposed data products by expected impact on growth or efficiency—then cut the bottom third.
From: Optimizing Your Analytics Strategy for Real Results
18. Test Dashboards Like You Mean It
Before launch, validate data accuracy, assess user experience, and test performance. A dashboard that takes more than 5 seconds to load is a missed opportunity.
Pro Tip: Soft launch dashboards to a small group before full release—watch them use it without guidance.
From: Dashboard Details: Test and Launch
19. Storytelling Isn’t Optional
Data needs narrative. Use classic storytelling elements–characters, conflict, resolution–to make dashboards and reports memorable and effective.
Pro Tip: Try structuring your dashboard like a narrative: headline (KPI), supporting details (breakdowns), resolution (next actions).
From: Writing a Story with Data
20. Know When to Use a Dashboard
Dashboards are powerful, but not always appropriate. Use them when users need real-time interaction—not when static reports would suffice.
Pro Tip: If your content doesn’t change often or doesn’t require interaction, skip the dashboard and use a static report.
From: Why Dashboards
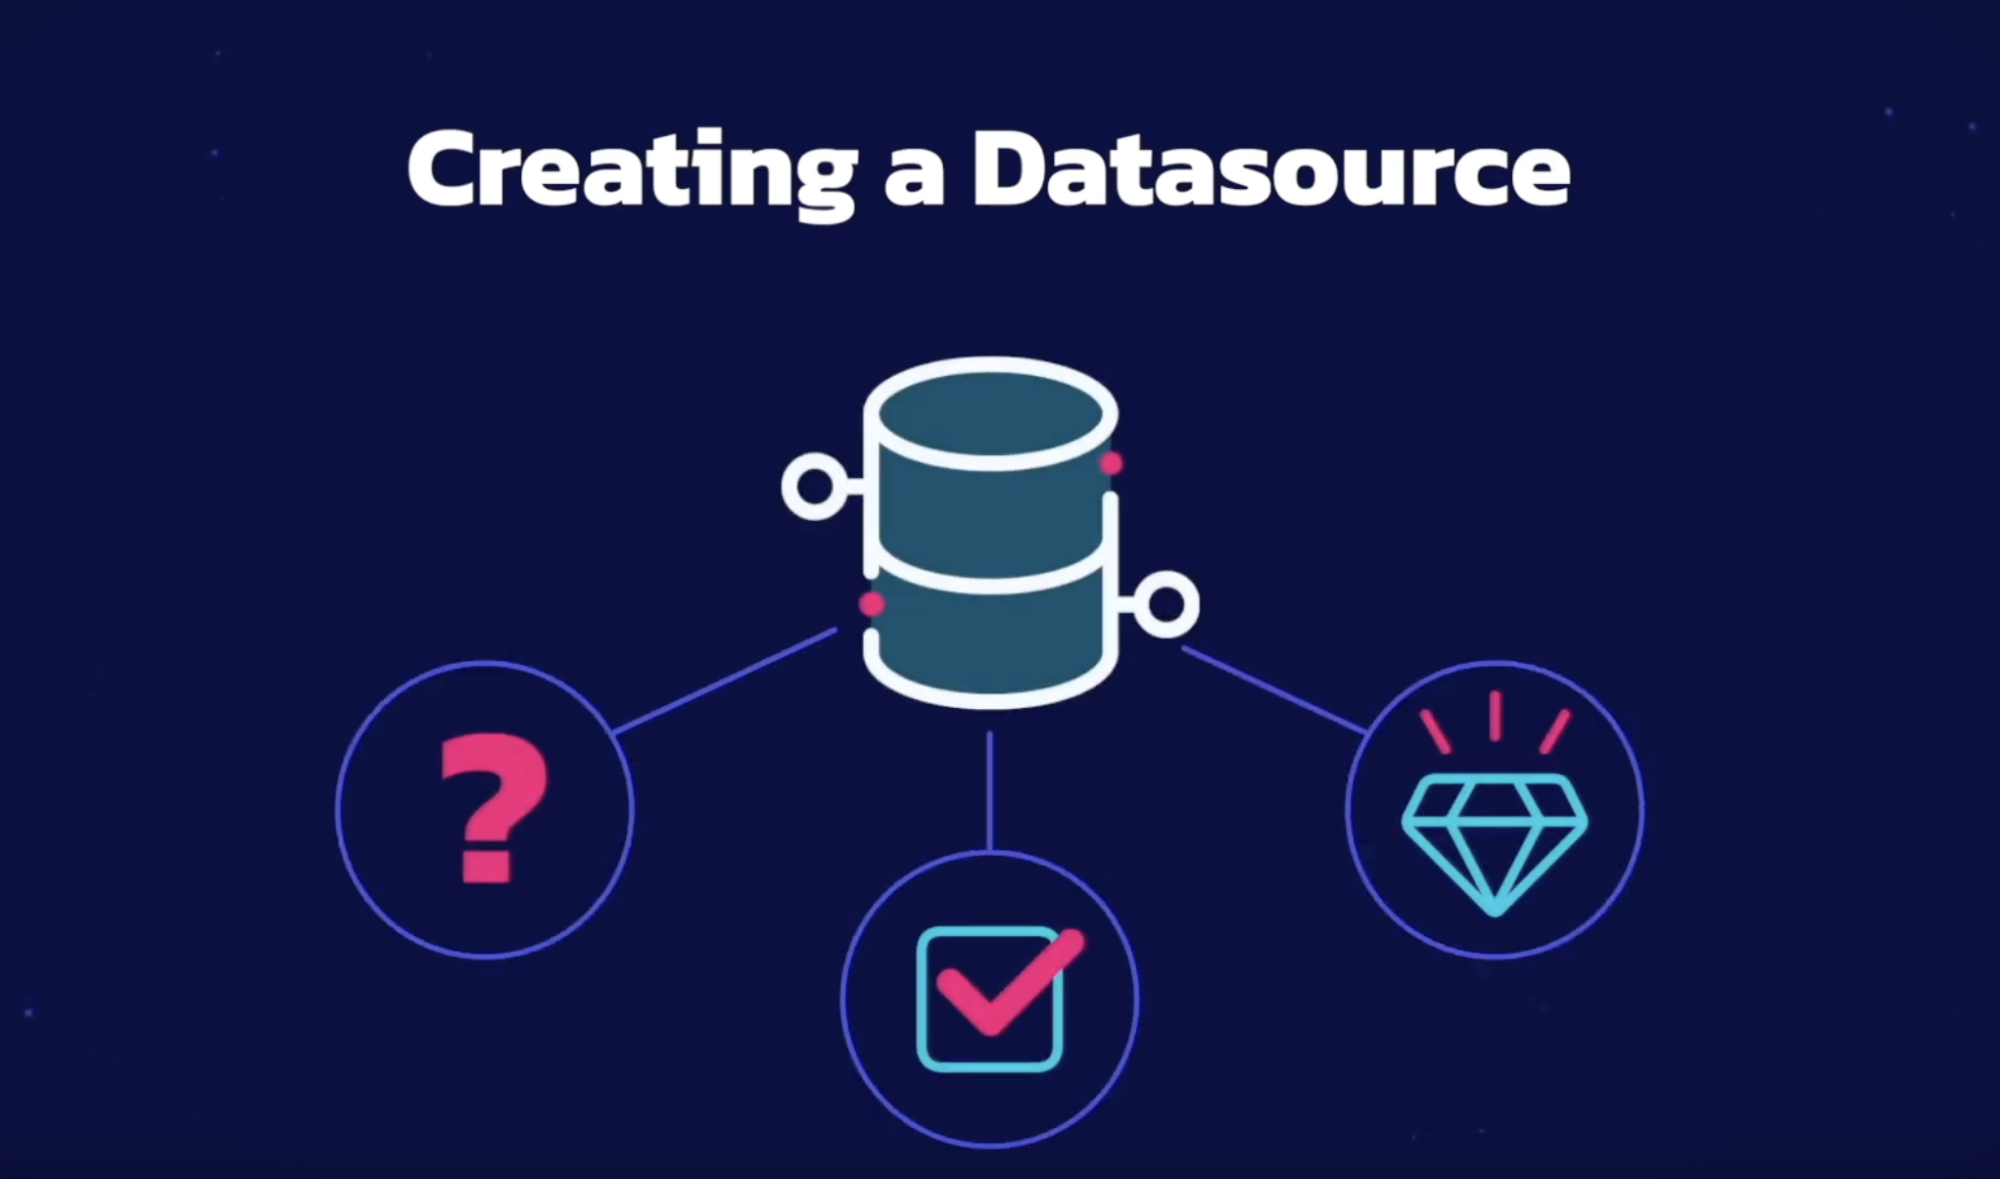
21. Build Efficient Data Sources
Design data sources with both machines and humans in mind. Maintain two versions of documentation: one for devs, one for stakeholders.
Pro Tip: Maintain two versions of documentation: technical (for devs) and explanatory (for stakeholders). Keep both up to date.
From: Creating a Datasource for Your Dashboard
22. Solve the Right Problem
When someone requests a dashboard, dig deeper. Use the “Five Whys” method and mind mapping to find root causes before building anything.
Pro Tip: Ask “Why?” five times. What your stakeholder wants is rarely what they actually need.
From: How to Cut Through the Noise
23. Audit Dashboards for Design Quality
A well-designed dashboard respects users’ time. Review visual hierarchy, remove unnecessary tooltips, and make sure users never feel lost.
Pro Tip: Create a quarterly dashboard audit checklist and review for clarity, loading speed, hierarchy, and visual balance.
From: Elements of a Well-Designed Dashboard
From Insight to Action
At Action, we’ve learned that data success doesn’t come from tools alone–it comes from clarity, curiosity, deliberate design, and creating an effective shared reality among a data team. Whether you’re launching a new dashboard, scoping a project, or aligning a team, use this guide as a catalyst and checklist.
Want help applying these practices to your own company? Let’s talk.
Shaun Davis, your personal data therapist, understands your unique challenges and helps you navigate through the data maze. With keen insight, he discerns the signal from the noise, tenaciously finding the right solutions to guide you through the ever-growing data landscape. Shaun has partnered for 10 years with top data teams to turn their data into profitable and efficiency hunting action. Learn more about Shaun.