Thought Leadership
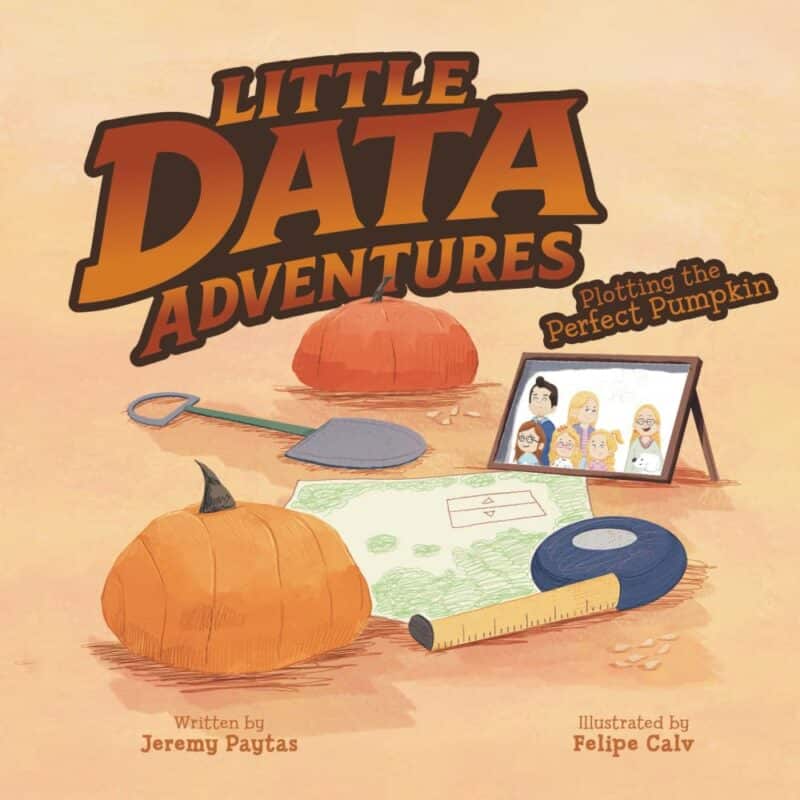
Actionaut Jeremy Paytas Wrote a Children’s Book
What happens when a data strategist applies analytics thinking to a children’s book? In Little Data Adventures: Plotting the Perfect Pumpkin, Action’s Jeremy Paytas introduces kids to data visualization through curiosity, play, and storytelling. In this interview, we sat down with Jeremy to find out why visual literacy matters early, how kids really understand data, and what growing up data-curious can unlock later in life.

You spend your days working with complex analytics problems. What made you want to create a children’s book about data and data visualization?
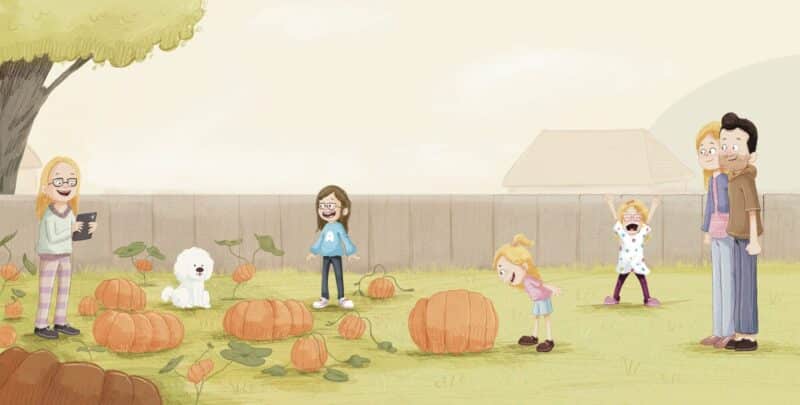
I wanted to make those complex problems feel simple and relatable. The idea of entering a pumpkin contest and using data visualizations to overcome the hurdles of choosing the best part of the yard, selecting the right seed types, ultimately choosing the right pumpkin, and then comparing your results to previous winners felt very real and tangible.
A lot of “kid-friendly” explanations quietly underestimate kids. How did you think about what children are actually capable of understanding when it comes to data?
I can speak from experience that my kids constantly amaze me with their ability to learn and adapt. One of the real powers of data visualization is that it helps reduce cognitive load. It’s easy to see that one bar is longer than another, or that the dot closest to the center of a scatterplot represents the right balance of height and width, rather than having to say, “This number is larger than this one, but smaller than that one, so it’s somewhere in the middle. Now how does this next number fit in?”
The book leans heavily on visual explanation. Do you think data visualization should be taught as an early literacy, alongside reading and math?
Absolutely. There are times when I see it in action with my kids. My eyes light up when I see a bar chart in their homework pack, or even an addition or subtraction number line to help with the basics. I believe data literacy is a tremendous life skill, whether it’s understanding personal finances or tracking progress in activities like video games or exercise.
When you’re explaining data to kids, how do you strike a balance between storytelling and precision?
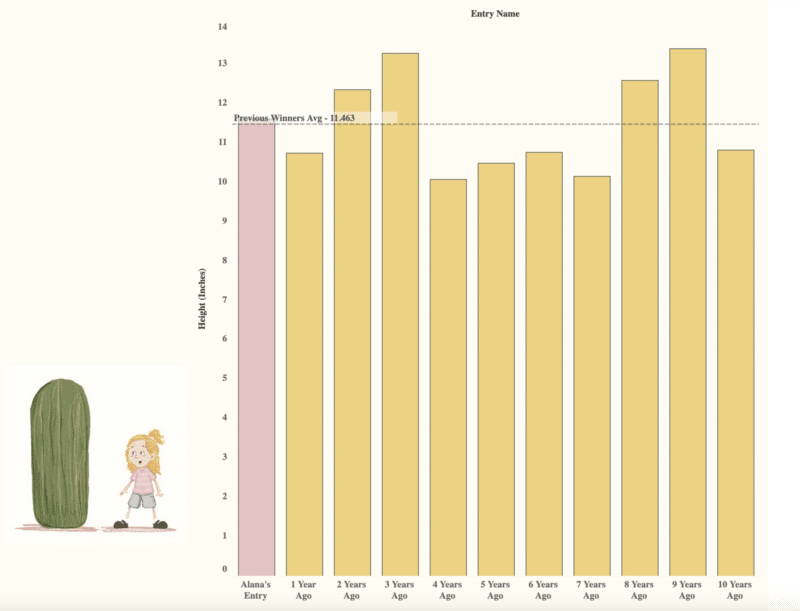
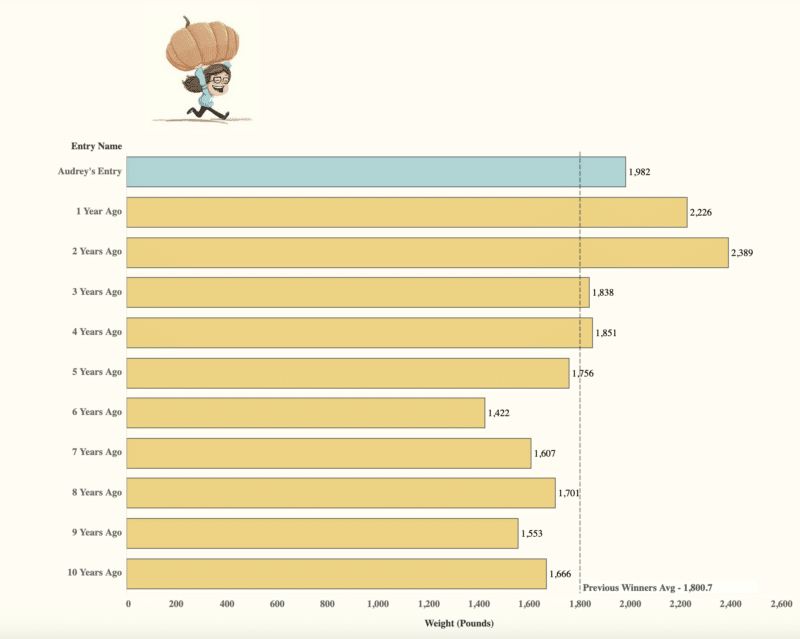
That’s a good question, and a tough one. In the book, I chose to display bar charts without exact numbers shown next to the bars, and took the same approach with the scatterplot. My goal was to avoid things feeling overly crowded or noisy. What’s shown in the book strikes a good balance, giving children enough information to interpret the results without overwhelming them.
Kids are incredibly sensitive to fairness. Did that shape how you thought about examples, comparisons, or categories in the book?
They really are. Kids are built with an innate sense of fairness, and that absolutely shaped the story. It was important to me that the largest and longest pumpkins were not the clear winners (spoiler alert). They were above average, but not the highest of all time. That opened the door to the possibility of not winning, which I think is an important life lesson. You can’t always expect to win.
If more people grew up comfortable understanding and questioning data charts, how do you think that might change decision-making later in life?
A bit of healthy skepticism is an important life lesson. Data is incredible in how it can help tell stories and craft narratives, but there are times when you have to question, “Am I seeing everything?” or “Is this the full story?” Showing children that they can dig deeper, research the data themselves, and that it’s OK to ask questions helps them build independent thinking and confidence.
Working at Action means being surrounded by people who care deeply about data, communication clarity, and how visualization can change minds. Did that ethos shape the book?
Yes. One of the things I enjoy most about being an Actionaut is our shared values: integrity, transparency, autonomy, curiosity, compassion, and, of course, fun. These are values I hold near and dear. I believe my peers and I share a strong desire to get to the truth of the data and to use critical thinking to empower decision-makers.
What’s been the most surprising response you’ve received so far, from kids or adults?
It’s still relatively early, but people are most excited by the idea of taking an, at times, intimidating topic like data visualization and turning it into a children’s book. There’s real enthusiasm around taking something complex and making it simple, relatable, and true.
If a kid reads this book and only takes away one new habit of mind, what do you hope it is?
I hope they consider using data and data visualizations to help make informed decisions throughout life. We see charts, graphs, tables, and maps every day. My hope is that children aren’t intimidated when they encounter these visualizations in the wild, but instead feel curious and excited to learn more.
Do you have plans for future installments of Little Data Adventures?
Yes. I hope to continue the series within the year. I have many ideas for the family, placing them in situations where different types of visualizations help guide their adventures.
About the Author
Jeremy Paytas is a Lead Analytics Strategist at Action specializing in marketing measurement and analytics. He enjoys helping his clients solve complex questions through data and evangelizing the power of data visualization. Jeremy resides in the suburbs of Cleveland Ohio with his wife, four rambunctious “Little Data Adventurers”, and their pup named Cooper.