Newsletters
Humans Shouldn’t Have to Copy and Paste Data

Actionaut Shaun Davis’ “Analytics Advantage” is a weekly newsletter of actionable insights, proven strategies, and top tips for getting the most from your data and making high-stakes decisions with confidence. Here’s a sample issue. We hope you’ll subscribe.
***
If I achieve nothing else in life, it is my aim to eliminate the need for humans to copy and paste data from one system to another. It’s so dumb to have humans performing such a task.
This week, I’ll share three tools to ensure that you never have to copy and paste data again!
Here are the tools you can pick up today to stop copying and pasting:
Microsoft Power Query
Tableau Prep
Make
Microsoft Power Query
I’m normally not big on Microsoft products, but the ubiquity of their software makes them hard to ignore.
What it does:
Power Query automates a lot of the repetitive tasks you’re doing every day in Excel. Their website breaks the functionality out into four phases:
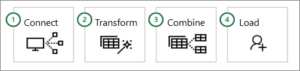
This is a very helpful way to view any data pipeline. Way to go, Mr. Gates!
Connect
Connect enables you to get data from one or multiple sources, which is where the highest ROI tasks come from.
For example, in the Connect phase, you could bring data from a database, and also from another spreadsheet, which helps clean up all those poorly named rows in the dataset.
Transform
Transform allows you to reshape each branch of data coming into your query.
An example of what you’re able to do here is filter out rows and columns. Say, the data you get from the database has 142 columns, but you only care about 12 of them. In Transform, you can select those 12 by name and get them every time. With a filter, you can limit the data to the past 30 days, speeding up your analysis and focusing on what your customers care about most.
Combine
Combine helps you bring data from two branches together. Let’s say you have a common identifier in the database and your spreadsheet. This will enable you to combine the rows where the data matches. No more fooling around with formulas.
Load
In Load, you decide where to store the data. This is where you can output to a tab in your workbook or a separate file.
The big benefit of Power Query is its ease of access and integrations within an Excel workbook. One major drawback is that it doesn’t work on a Mac.
Tableau Prep
Tableau Prep is a solid data automation tool that takes care of 80% of the tasks you might do manually in a spreadsheet. Like Power Query, there are a couple of main phases:
- Connect
- Transform
- Output
Connect
There are a host of data connectors available in Prep. Ranging from Files, Server (databases), and data already on Tableau Server. Check here for a full list.
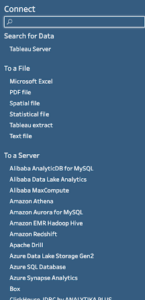
In the Connect tool, you can select the columns needed, filter data, and change data types. There’s likely a limit to how many connections you can use, but I’ve yet to find it.
Transform
There are a variety of tools you can use to reshape and clean your data. I’ll run through the three I use most often.
Clean
The Clean tool is the workhorse of Tableau Prep. Within it, you can filter data, group values, and remove or rename columns. One neat feature is the ability to combine words based on what they “sound like.” It also enables powerful use of a language called REGEX, which is used to dynamically find values in text. For example, if you wanted to remove all the punctuation from rows and make everything lower case, you can easily do it with the Clean tool.
Aggregate
Aggregating is a powerful way of focusing your analysis on what really matters. In this tool, you can group by specific columns (even different date parts) and aggregate numeric columns. No more pivot tables in Excel!
Join
Joining data is where you combine based on a shared value in two datasets. The Join tool in Prep is especially useful since it shows you the number of rows coming in and going out depending on your choices.
A couple of notes about Tableau Prep:
It’s not free. But if your organization is already using Tableau, it’s a great add-on. Prep struggles with large data sets and can be a bit buggy at times.
Make
Make is an online tool which allows you to bring together multiple data streams. It seems a bit more fully-formed than the other tools I’ve reviewed. Similar to the others, it has a variety of tools which enable connections, transformations, and outputs.
I’m less familiar with Make, but it seems to be a good fit when you’re working with data in web platforms or APIs. It also seems a bit more technical than the other two.
Why Automate?
Lastly, what’s the value in automating these processes?
Efficiency
The biggest reason is efficiency. Instead of copying and pasting the same data repeatedly, these tools enable you to build the process once and run it repeatedly.
Accuracy
By capturing the steps where your data is reshaped, these tools help automatically document when and where your data is changed. This reduces the chances the changes are buried in some formula in a spreadsheet.
Repeatability
Through automation, you no longer have to remember how to run a process that only happens once a quarter. These tools remember what you changed and many times allow you to add notes to memorialize why you made the change.
***
Want to take action?
- Book a Chat
- Subscribe to Analytics Advantage
What are you waiting for?
The clock is ticking…..