Tools of the Trade
A Practical Guide to Duplicate Data Detection
In working with data, ensuring the cleanliness and accuracy of your datasets is extremely important. Duplicate data, often a subtle but pervasive issue, can skew analysis and lead to misleading conclusions.
This “Action Bit” offers a practical guide to tackling this challenge head-on using Excel, SQL, and Tableau.
This companion post outlines the basics of duplicate data detection and management.
Step 1: Visual Inspection with Excel
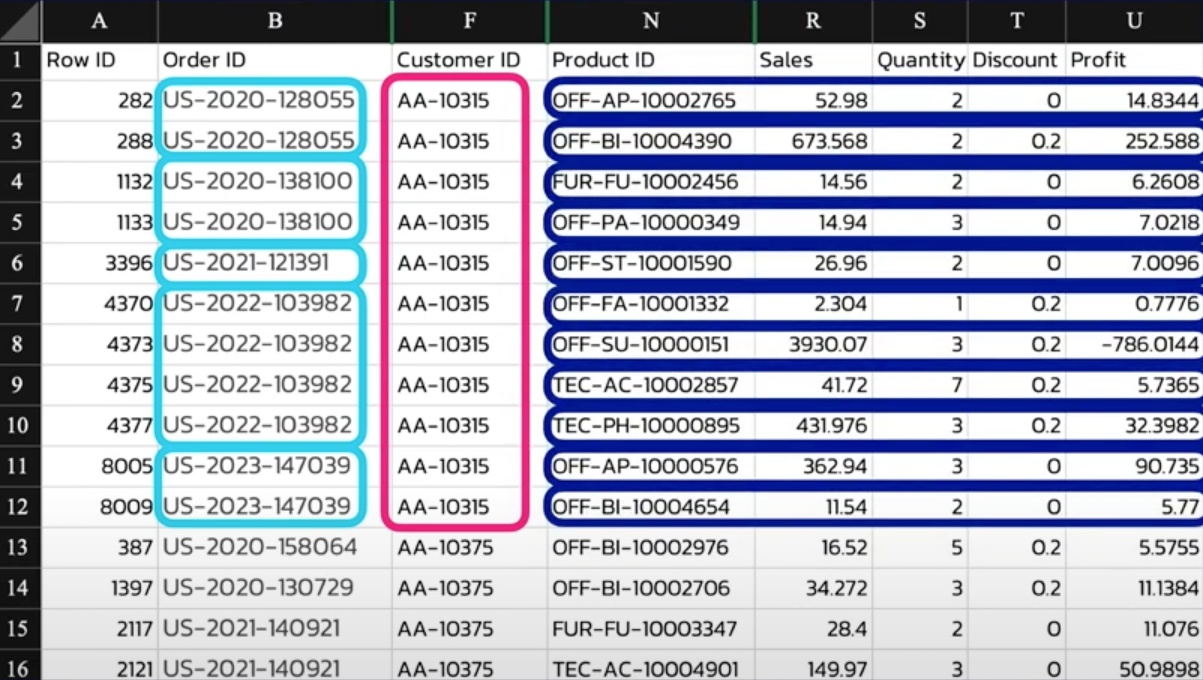
Begin your data cleaning with a visual inspection of your dataset in Excel. This initial step helps you get acquainted with the data’s structure and identify potential duplicate indicators.
Focus on Identifiers: Concentrate on columns that serve as unique identifiers (e.g., Order ID, Customer ID, Product ID). These fields are crucial for distinguishing between records.
Categorize Data: Group your data by these identifiers to visually check for duplicates. Excel’s sorting and filtering features can be invaluable here.
Step 2: IDing Duplicates with SQL
With a basic understanding of your data’s layout, it’s time to identify duplicates using SQL. SQL provides the precision needed to programmatically ID duplicates based on specific criteria.
Crafting Your Query: Select your key identifiers and use the GROUP BY clause to aggregate records. The magic happens with the HAVING clause, which allows you to filter groups containing more than one entry.
 SELECT OrderID, CustomerID, ProductID, count(1) as Row_Count
FROM your_table
GROUP BY OrderID, CustomerID, ProductID
HAVING COUNT(1) > 1

Analyzing Results: The query results will highlight duplicates. Examine these records to understand why duplicates occurred and how they might impact your analysis.
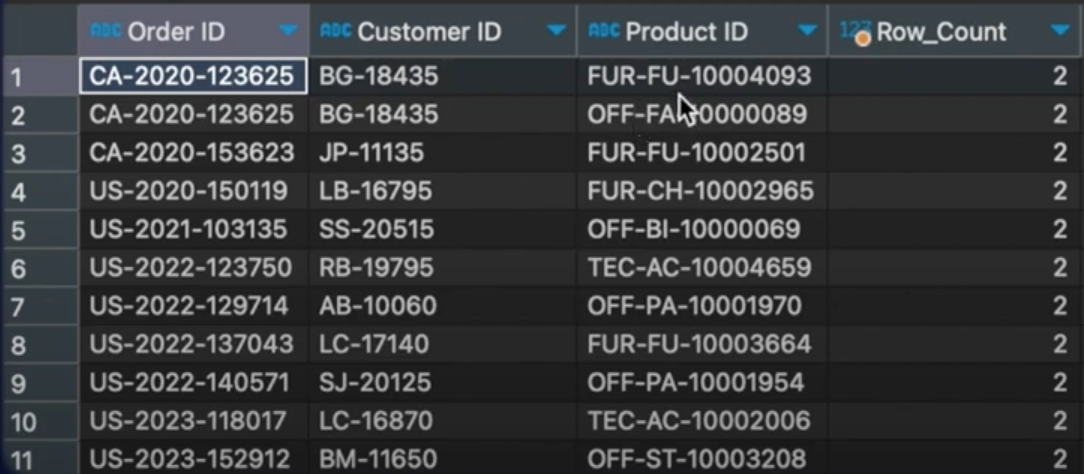
Step 3: Visualization with Tableau
Tableau transforms your analysis into an interactive visual experience, making it easier to spot and understand duplicates.
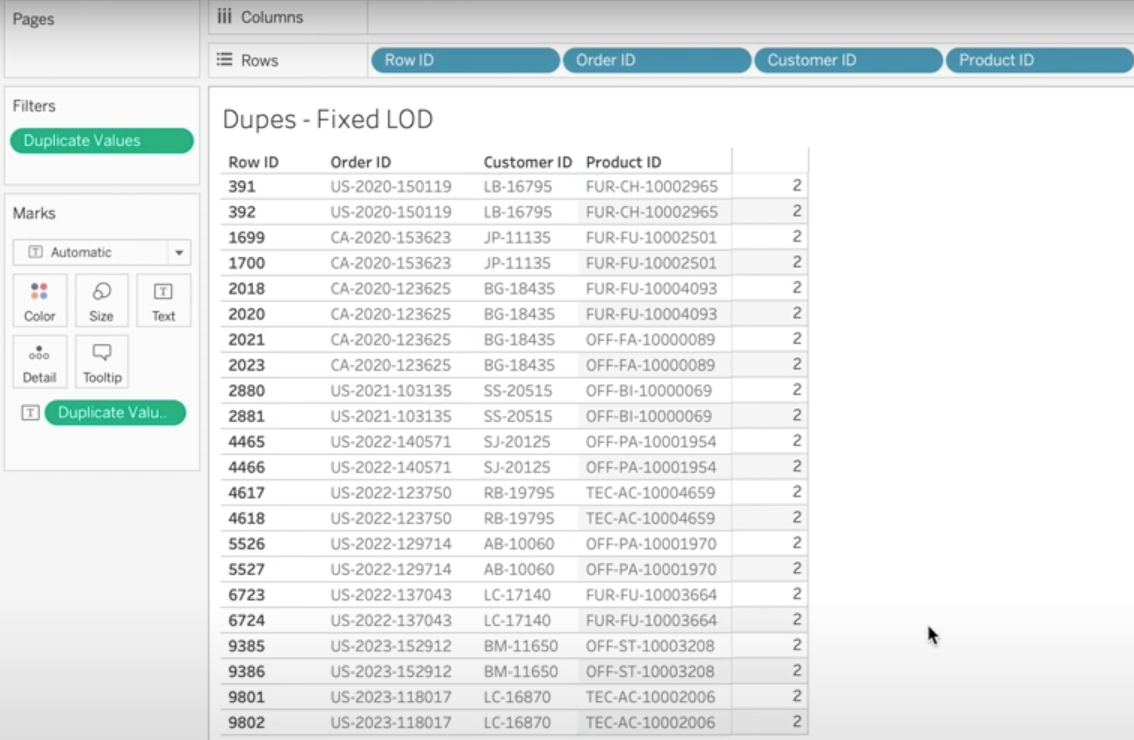
Setting Up Your View: Drag your identifiers (Order ID, Customer ID, Product ID) to the Rows shelf. Use Tableau’s aggregation features to count the number of records for each unique identifier combination.
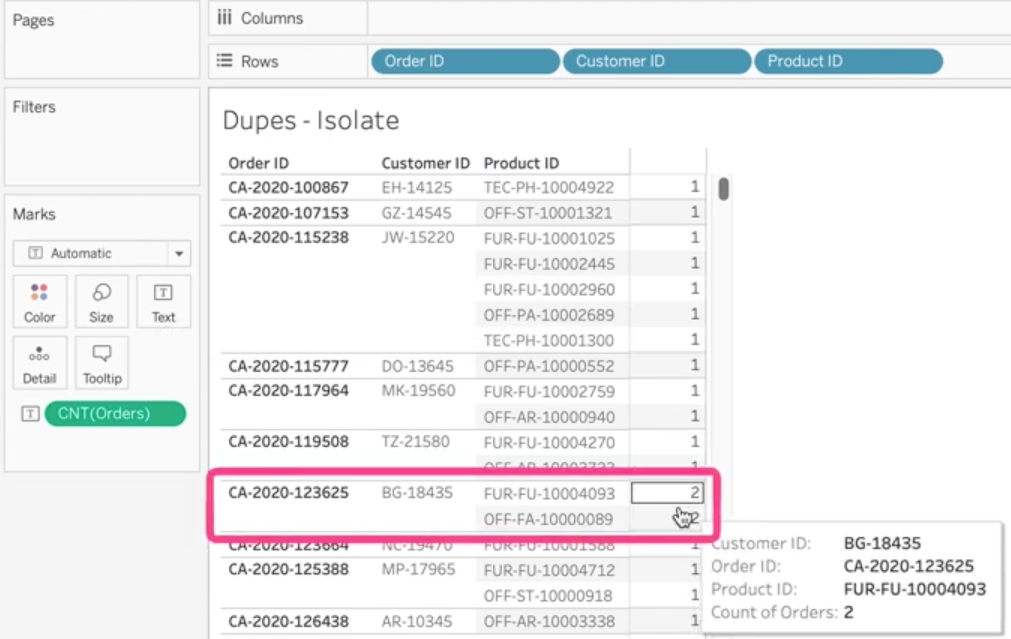
Applying Filters: Leverage Tableau’s filtering capabilities to isolate duplicate records. This visual representation can reveal patterns and anomalies that were not immediately evident.
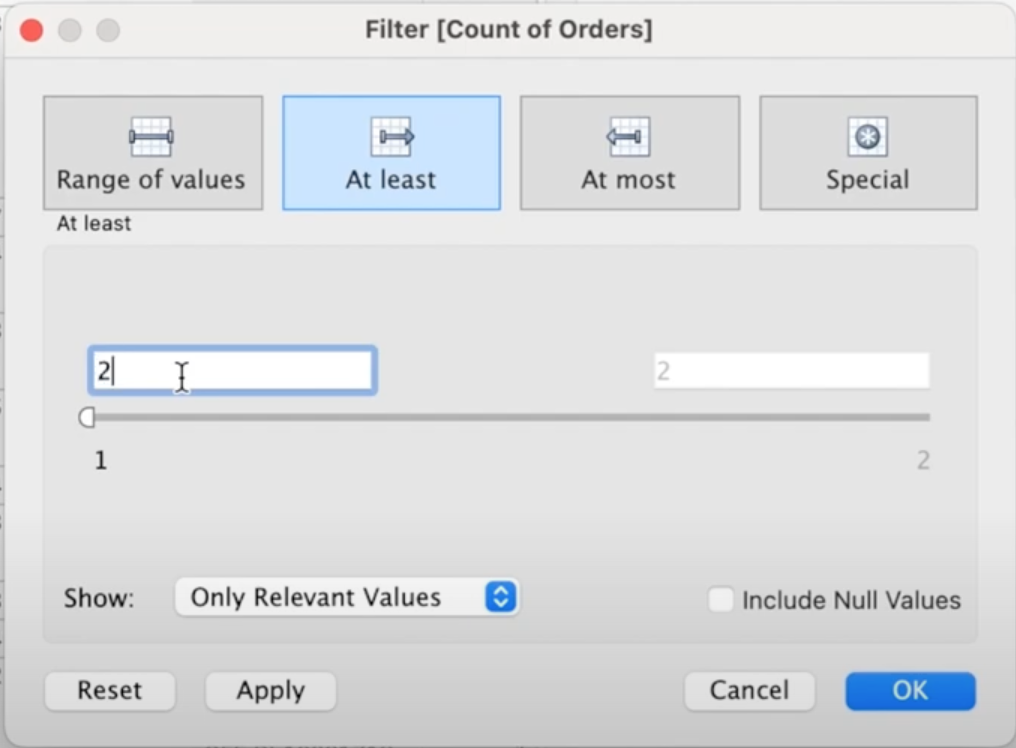
Fixed LOD Expressions: For more complex scenarios, Fixed Level of Detail (LOD) expressions can fine-tune your analysis, ensuring that your duplicate detection is as accurate as possible.
{ FIXED [Order ID], [Customer ID], [Product ID]: COUNT([Row ID])}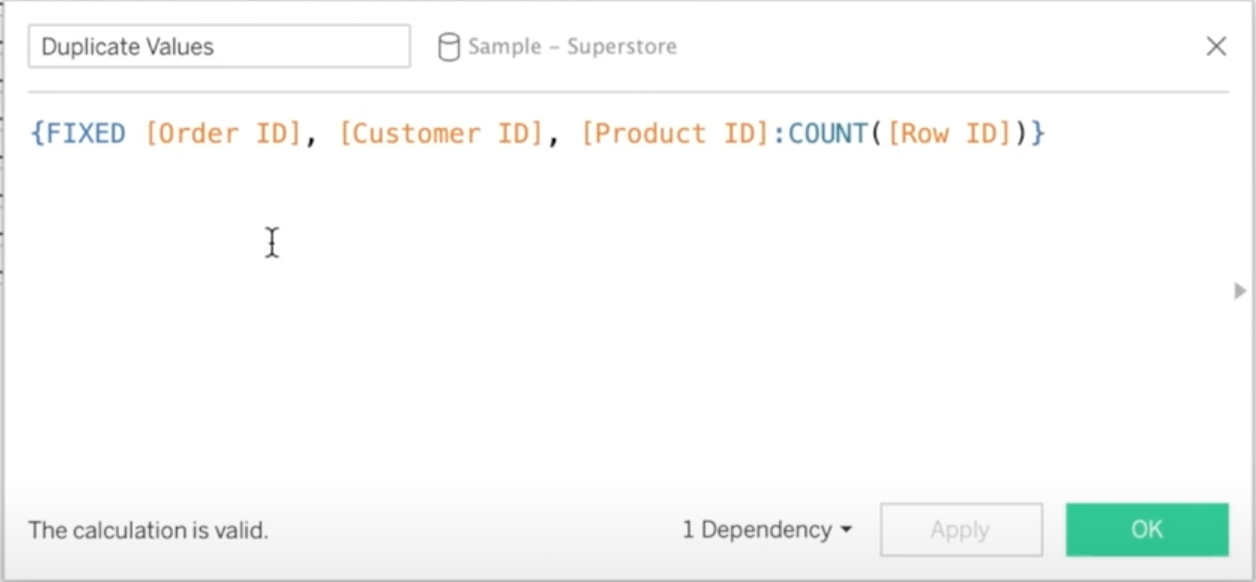
Taking Action
Identifying duplicates is only the first step; the next is deciding how to handle them. This could mean merging duplicate records, removing them, or investigating their cause to prevent future occurrences. Engage with stakeholders, such as data entry teams or system administrators, to address the root causes of duplicates.
The process of identifying and managing duplicate data is crucial for maintaining the integrity of your analyses. By combining the strengths of Excel, SQL, and Tableau, you can develop a robust strategy for ensuring your data’s cleanliness and reliability. Remember, clean data is the foundation of insightful, accurate analytics.


