

Quick tips, tricks, and useful discoveries from within Tableau and the wider world of data visualization.
Resources and Show Notes
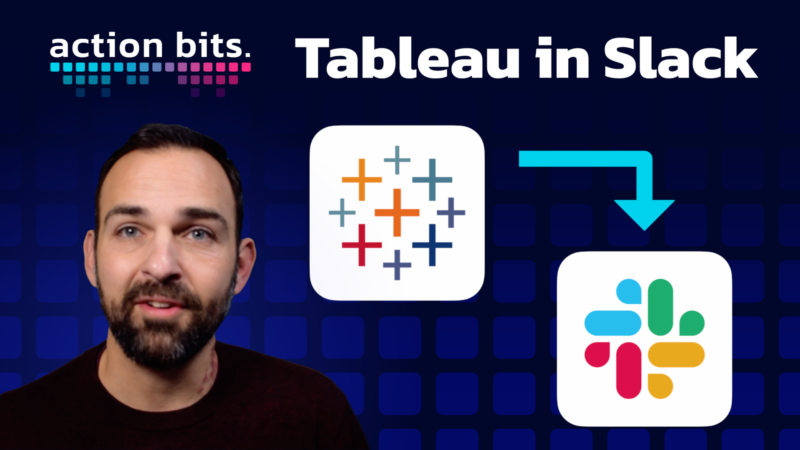
Tableau in Slack
In this Action Bit, Jeremy Paytas shows how quick and easy it to embed a Tableau dashboard into Slack.
- Watch this Action Bit. on YouTube.
- Read the companion blog post.
- Tableau Developer Site.
- Slack Workspace.
- Tableau app in Slack.
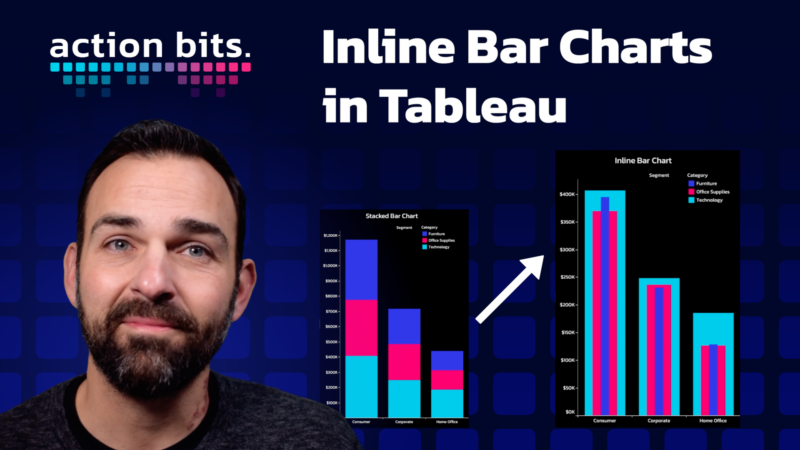
Inline Bar Charts in Tableau
In this Action Bit, Jeremy demonstrates how easy it is to turn a stacked bar chart into an inline bar chart. Inline bar charts offer a sleek, straightforward, and visually compelling way of comparing different categories or segments within your data.
- Watch this Action Bit. on YouTube.
- Read the companion blog post.
- Tableau Superstore Data.
- Action’s Tableau Public Page.
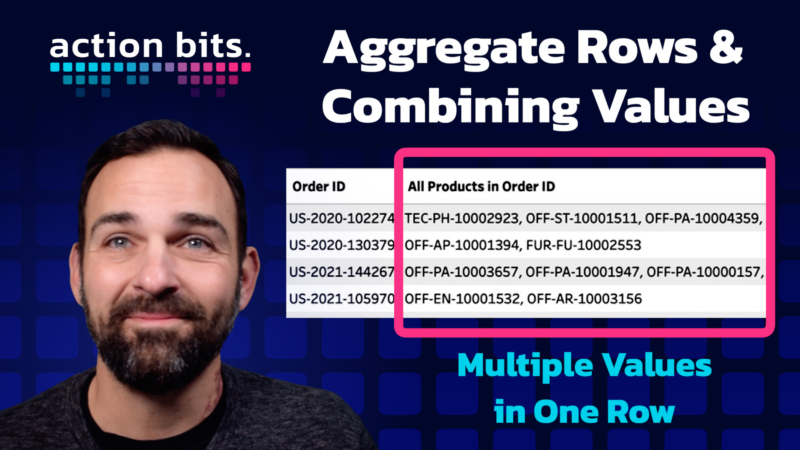
Aggregate Rows and Combining Values in Tableau
Here, Jeremy guides viewers through the process of aggregating rows and combining values in Tableau Prep. He shows how you can combine multiple orders with different products into a single aggregated field. What you end up with is an aggregated text field with product IDs separated by commas for each order ID.
- Watch this Action Bit. on YouTube.
- Read the companion blog post.
- Tableau Superstore Data.
- Tableau Prep workflow with all necessary steps..
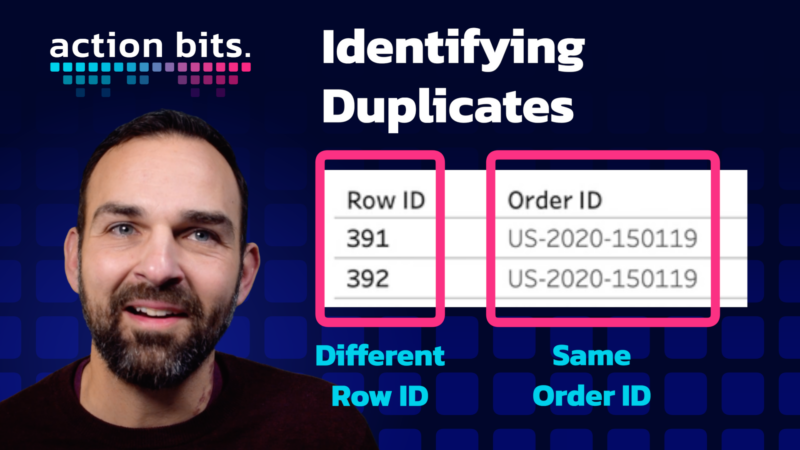
Identifying Duplicates in Data Full
Discover how to identify and manage duplicate data in your datasets in this latest Action Bit. Jeremy offers a step-by-step guide on using tools like Excel, SQL, and Tableau to pinpoint and analyze duplicate entries effectively.
- Watch this Action Bit. on YouTube.
- Read the companion blog post.
- Tableau Superstore Data.
- SQL code to ID duplicates and Tableau workbook.

Web Images in Worksheets
In this “Action Bit,” Jeremy shows how to seamlessly integrate URL images into Tableau. He walks through the entire process—from preparing your data and importing image URLs to formatting them for a polished dashboard. You’ll also discover how to use tooltips to enrich your visualizations by displaying additional information when users hover over specific elements.
- Watch this Action Bit on YouTube.
- Read the companion blog post.
- See Jeremy’s Reading List on Tableau Public.
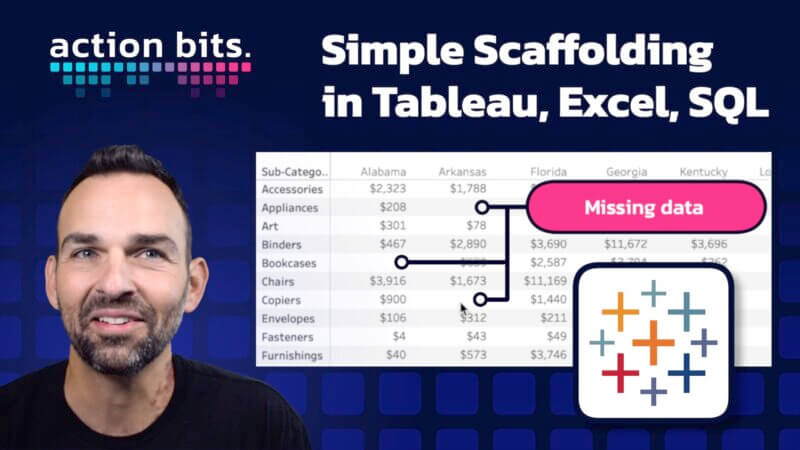
Simple Scaffolding in Tableau, Excel, SQL
Learn the essentials of data scaffolding in this Action Bit with Jeremy Paytas. In it, Jeremy covers simple scaffolding in Tableau, SQL, and Excel. Discover how scaffolding helps fill missing data, optimize reporting, and prevent errors in data joins.
- Watch this Action Bit on YouTube.
- Read the companion blog post.
- Tableau Superstore Data.